Review Expensive Objects (Telemetry)
Cadence Daily
Sites production
| Initial | Recurring | |
|---|---|---|
| Estimated Time | 35 min | 8 min |
Benefits:
- Optimize objects
- Increase performance
- Control thresholds
Goal
The goal for this spot-check is use the Qlik Sense Telemetry Dashboard to look for expensive objects. This process is ideal to be generally aware of the performance of a Qlik Sense Enterprise deployment. With a narrow set of items to focus on, action can be taken to improve performance.
Table of Contents
Prerequisite
The Qlik Sense Telemetry Dashboard is a project created and maintained by the Enterprise Architecture team in Qlik’s Americas Presales organization. It leverages additional logging which can be enabled in Qlik Sense Enterprise February 2018 and newer releases of Qlik Sense with some data enrichment with API calls to provide visualization-level performance data for Qlik apps. The goal of the tool is to present this performance data in actionable ways for administrators / developers to have precision when focusing on performance improvements for Qlik apps.
Telemetry Dashboard - Details
Note
What is considered an unacceptable threshold will vary by environment. Generally visualizations which take over 60 seconds to render or apps which take over 2 minutes to open are highly undesirable from an end-user experience perspective. These are good baselines for qualifying problematic behavior in an environment. As optimizations are applied, tackling marginally undesirable response times can be undertaken.
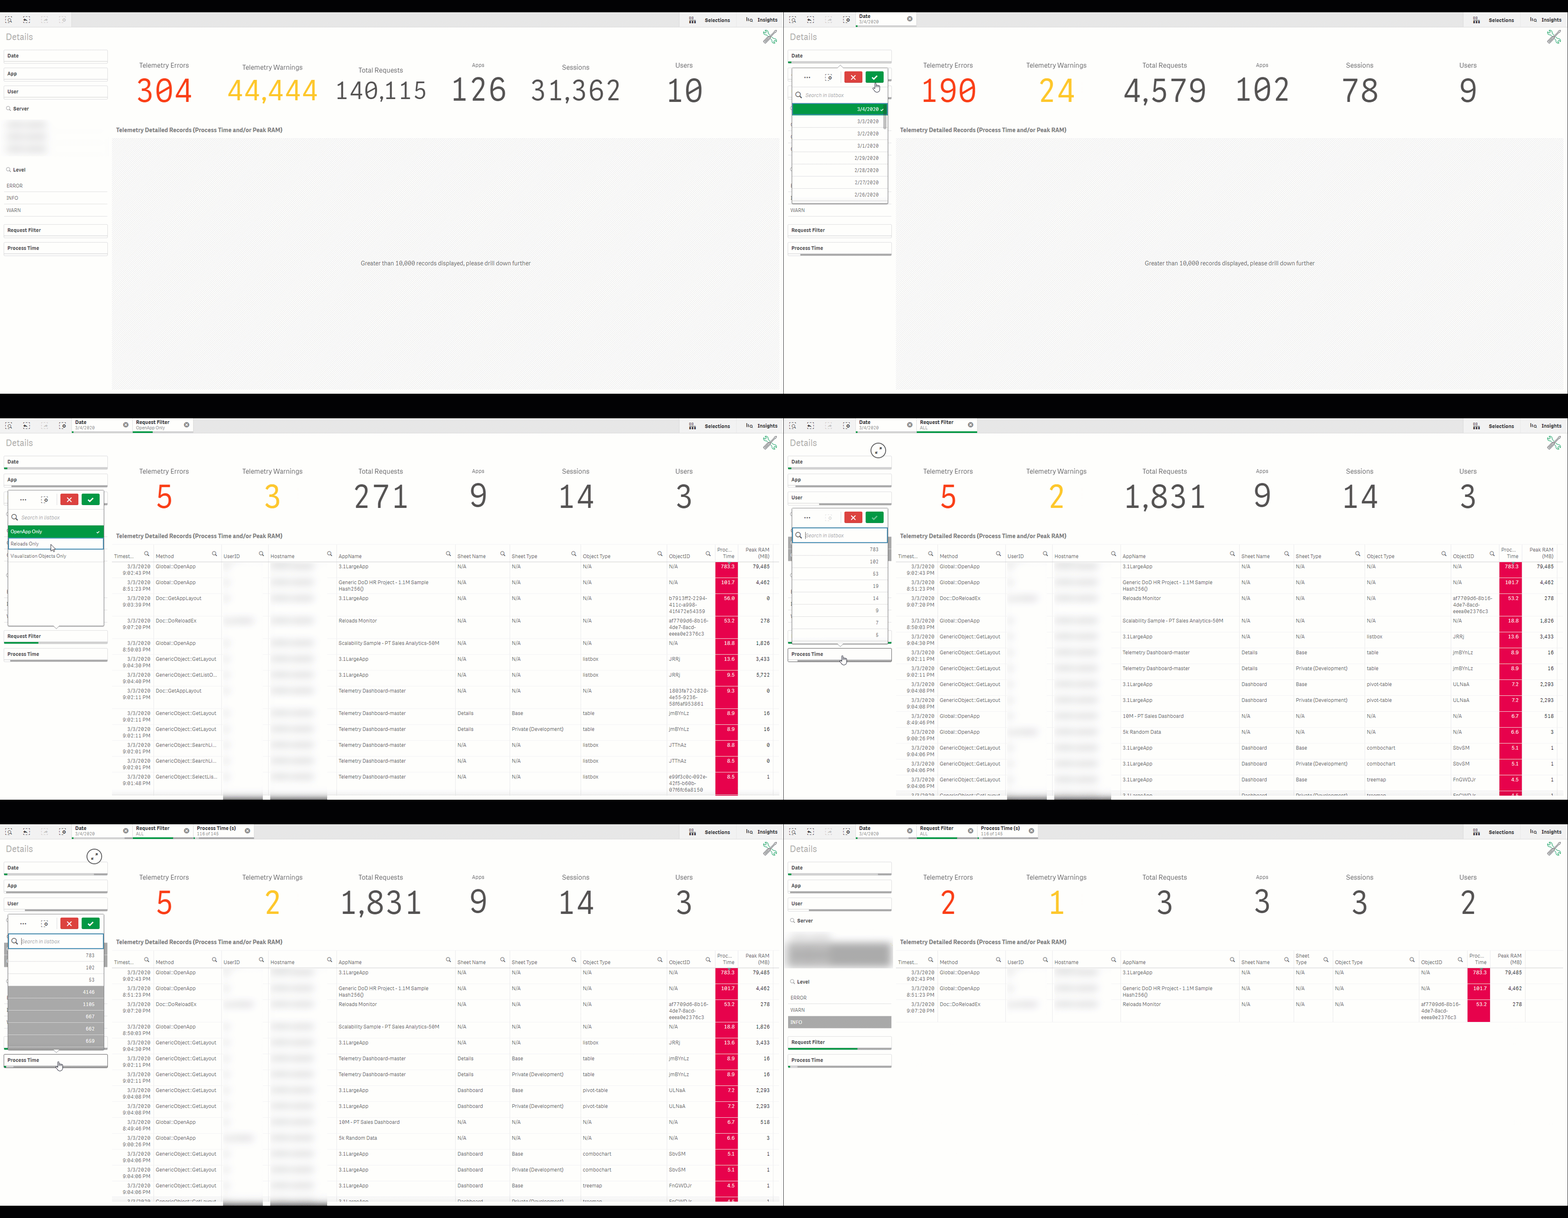
Open the Qlik Sense Telemetry Dashboard application and navigate to the Details sheet. Inside this sheet, drill to the most recent day (since this task is a daily task), select the relevant Request Filters, and drill to the Process Time values which broach the threshold that you are interested in. Example:

For this example, we are interested in Visualization objects, App Open Events, and Reloads which have taken more than 30 seconds.
- The primary Engine calls which are relevant for most users of the Telemetry Dashboard are:
- OpenApp : The request to the Engine to open an application. This is the time it takes for the Engine to request the application binary from disk, load it over the network, and un-compress it to RAM.
- Reloads : How long a reload execution takes. This type of request is less frequently relevant to most organizations. At least for the scope of this task.
- Visualizations : The request to the Engine to render a visualization, e.g. a table chart.
- A more exhaustive write-up of the Telemetry Dashboard is found here
With a narrowed set of interactions, action plans can be constructed. For example:
- App Open : If the threshold is unacceptable given the important of the application, then a cache warming process may be appropriate. Reference our article on Cache Warming here for more specific guidance on techniques.
- Visualization : Use the data from the Telemetry Dashboard like App, Sheet and Object Type + ObjectID to reach out to the application’s owner and/or maintainer in order to focus optimization efforts. Since the Qlik Sense Telemetry Dashboard does not imply a specific fix, the developer will need to review the application to see what improvements can be made. Potential avenues for fixes:
- Table / Pivot Table : Use calculation conditions to force drill downs.
- Other visualizations : Review expressions used. Simplify where possible and/or off-load the calculations to the application’s load script to pre-calculate. The Diagnostic Toolkit project can be used for reference.
Tags
#daily
#spot_check
#telemetry
#telemetry_dashboard