Capacity Plan: Users
Goal
The goal of this exercise is to identify user activity over a period of time since this exercise was last ran to identify variances in usage and anticipate future growth.
There are a number of metrics that should be focused on, including the following:
- Peak Concurrency
- Active Users 1+ Sessions
- Active Users 5+ Sessions
Table of Contents
Operations Monitor
This page leverages the Operations Monitor. Please refer to the Operations Monitor page for an overview and relevant documentation links.
Confirm Operations Monitor is Operational
Navigate to the Monitoring apps and select the Details button (info icon) on the Operations Monitor application. Confirm that the application’s data is up-to-date.
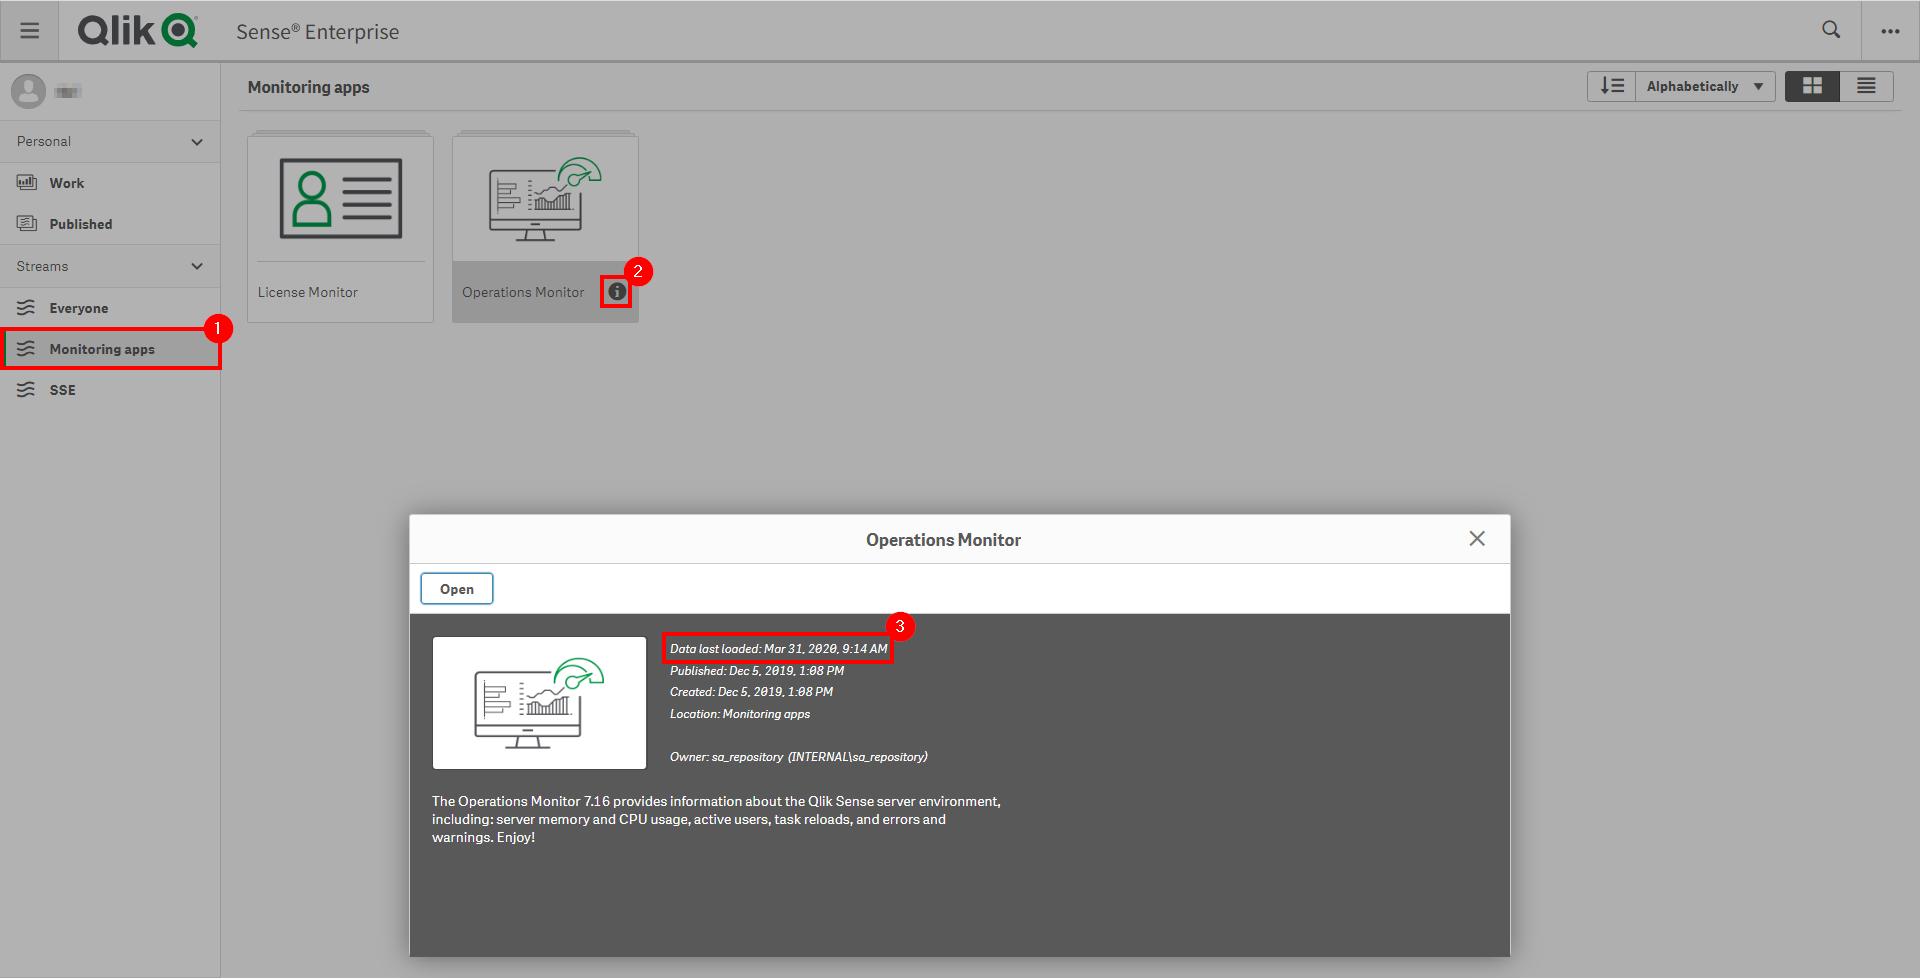
If the Operations Monitor is not up-to-date, please refer to the Operations Monitor Documentation for configuration details and troubleshooting steps.
User Activity
Gather Metrics
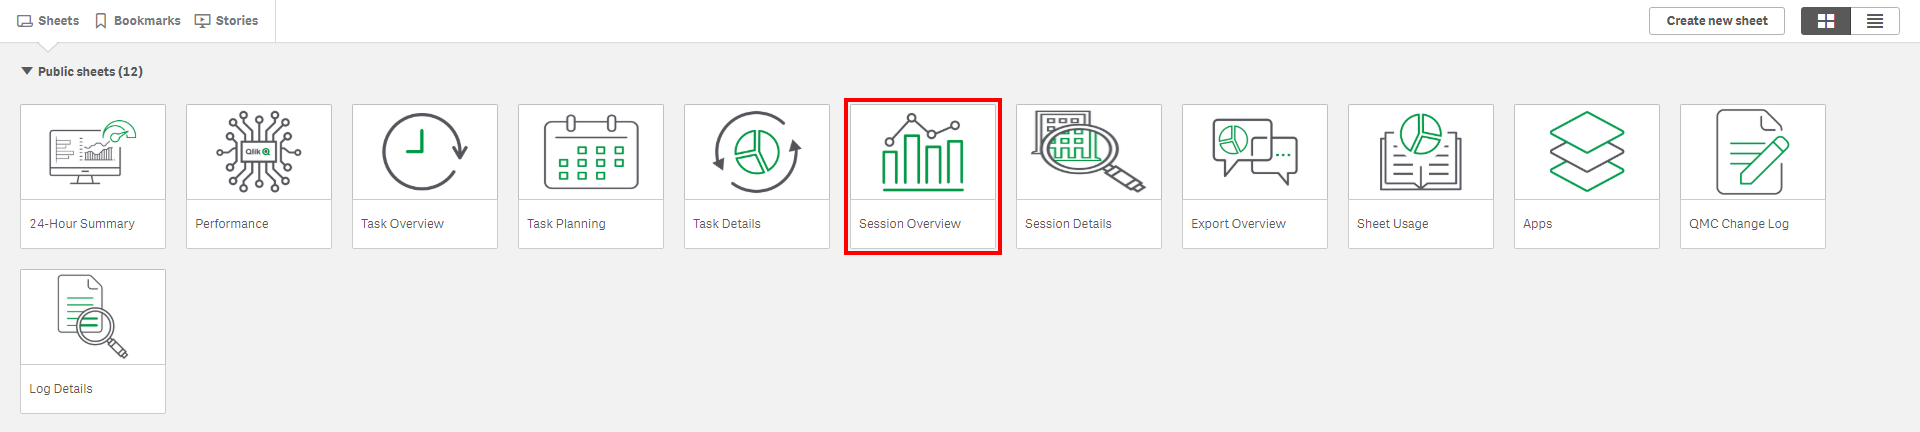
Select the Session Overview sheet from the Operations Monitor.
Now, assuming this capacity plan exercise is in fact being executed quarterly, select the last three months of session data. This can easily be achieved by selecting the target months in the User and App Count Trend chart in the bottom right. The Latest Activity Measure field that always has one selected does not apply to this area, and only applies to sheet usage–so it can be ignored.
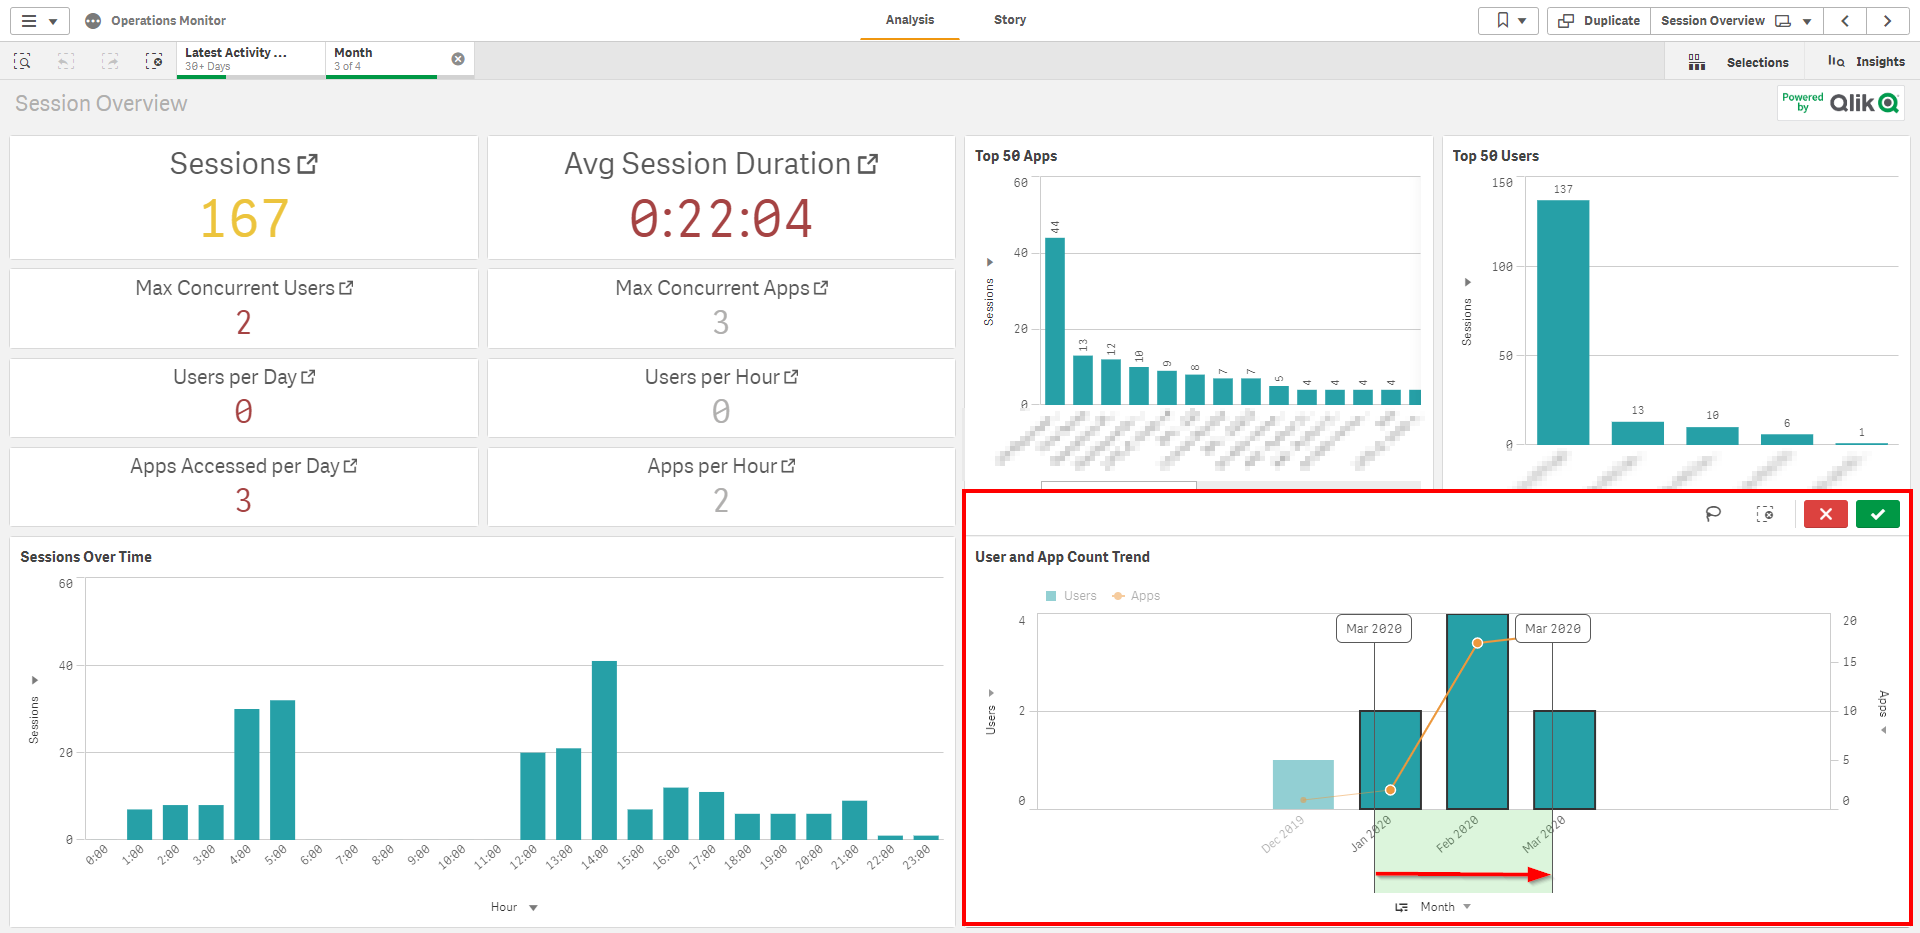
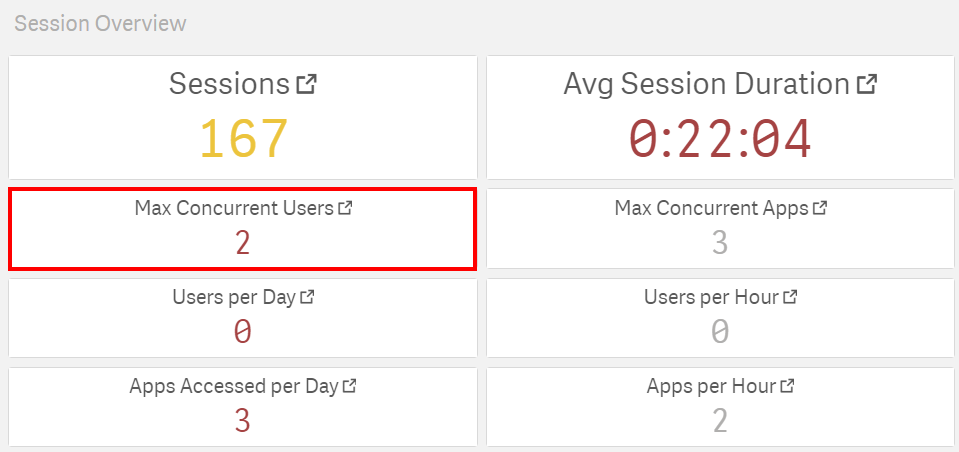
While remaining on this sheet, take note of the Max Concurrent Users KPI. This is the Peak Concurrency KPI mentioned above, and is critical to help plan for growth from an architecture perspective.
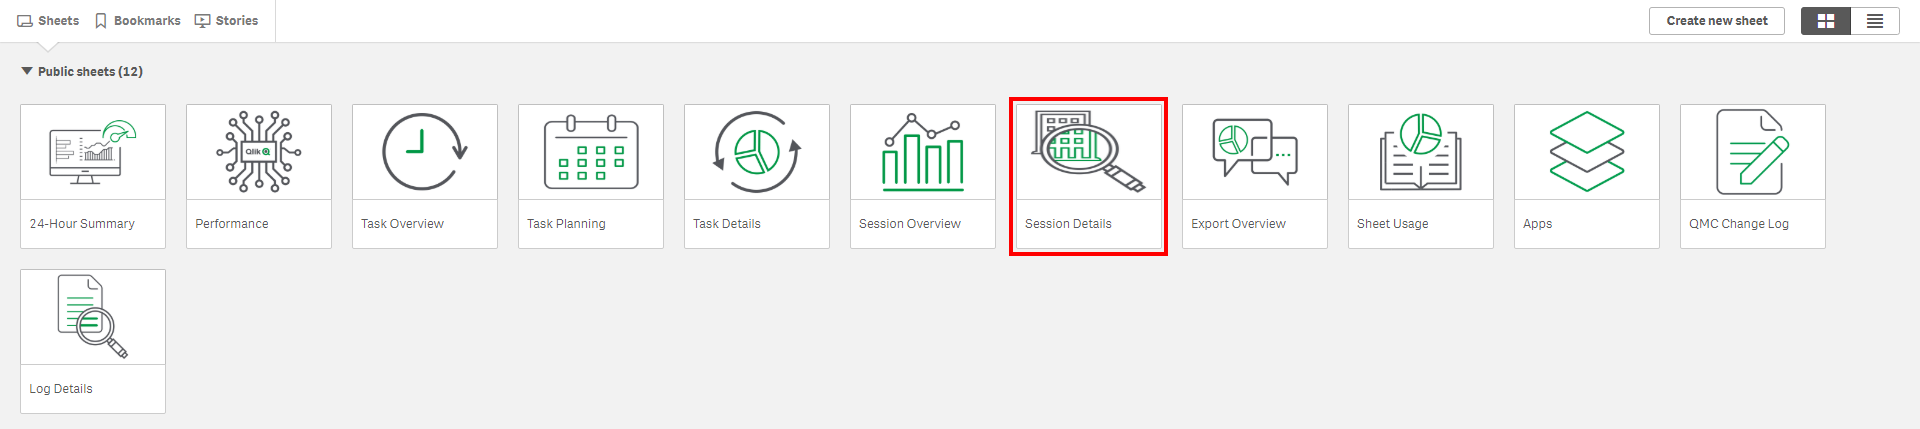
Following, select the Session Details sheet.
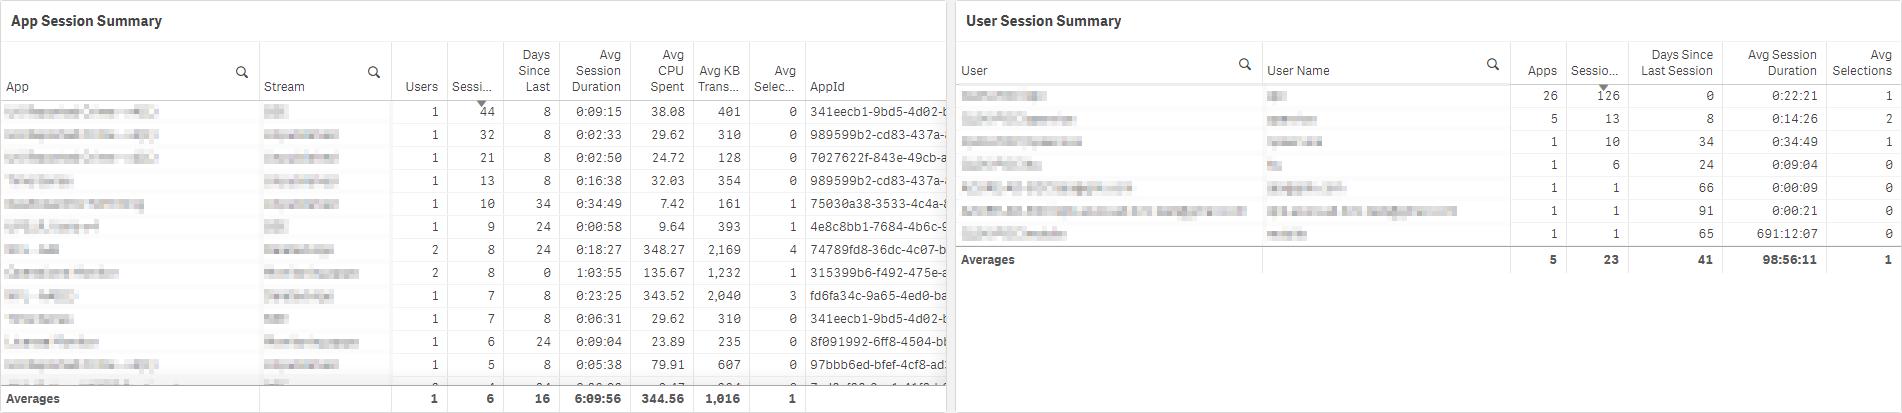
Next, be sure to review the App Session Summary object as well as the User Session Summary objects as they display valuable information, such as how many individual sessions users have had, and against what applications. These are very useful metrics both for overall user usage and adoption, and will impact the Applications section of the capacity plan.
That being said, two additional metrics that are not available by default on the sheet should be added:
- The total number of distinct users that have had at least 1 session over the last x days
- The total number of distinct users that have had 5 or more sessions over the last x days
These two metrics will help to identify and bucket how many active and semi-active users exist in the environment, and then will help with a license optimization exercise, which can be found here: Optimize License Allocations.
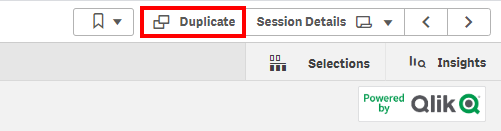
To add these two metrics, start by duplicating the sheet.
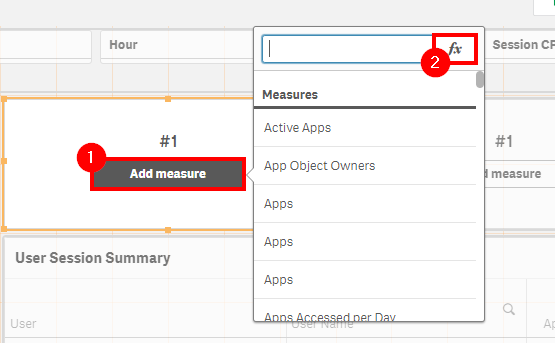
Following, find space for two KPI objects. For example, shrink down the User Session Summary table, and insert two KPI objects above it.
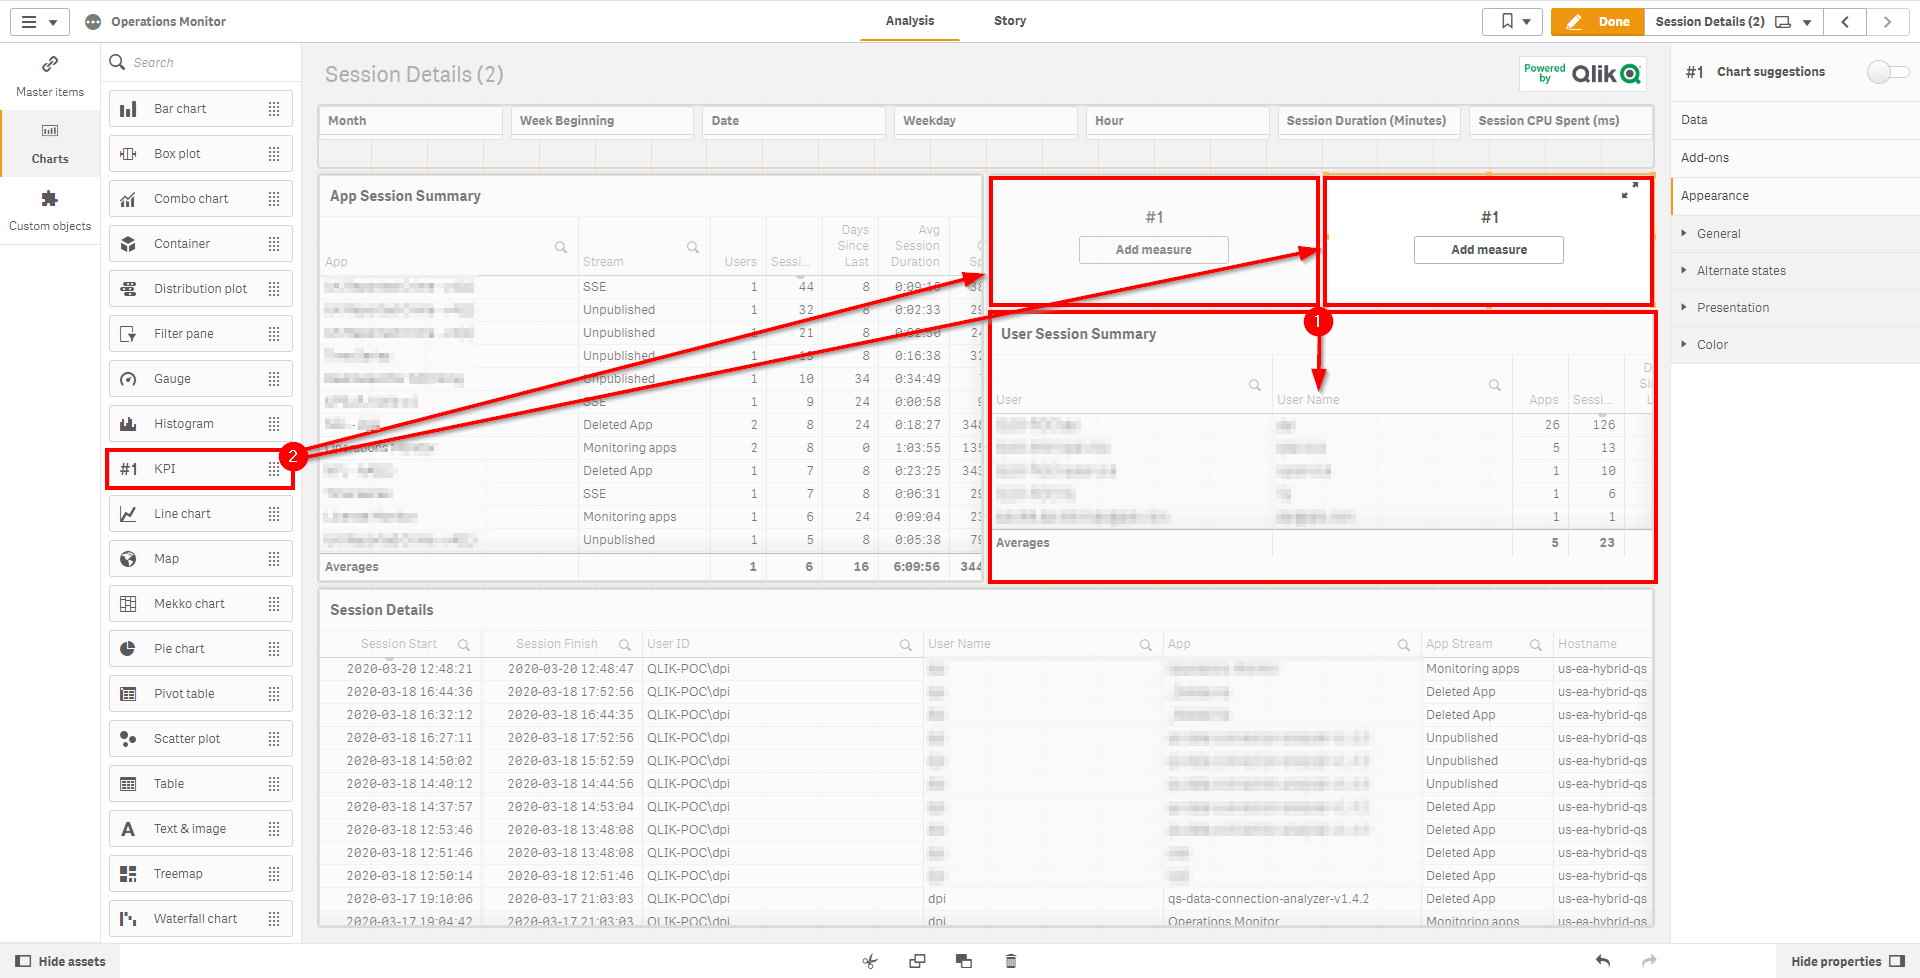
Next, select the first KPI and add the measure:
Count({<[User Name]={"=Sum([Session Count])>0"}>}DISTINCT [User Name])
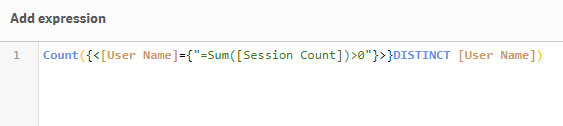
Name this KPI: Active Users: 1+ Sessions
Next, repeat the process above for adding the following expression to the second KPI:
Count({<[User Name]={"=Sum([Session Count])>=5"}>}DISTINCT [User Name])
Name this KPI: Active Users: 5+ Sessions
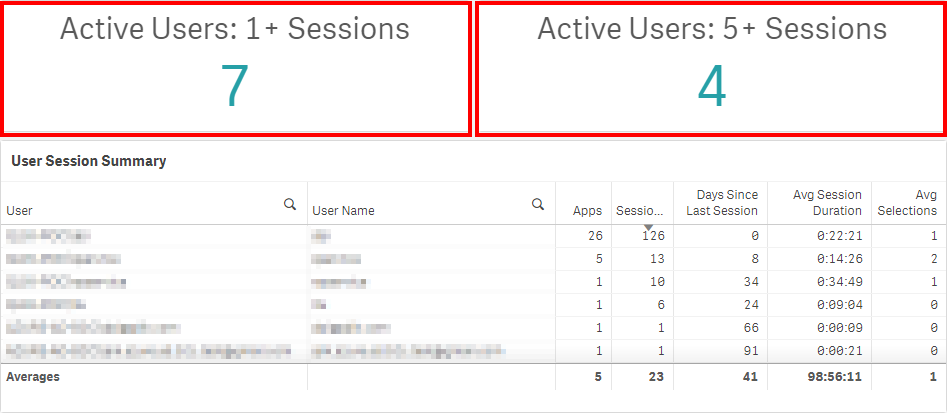
Example Takeaway
An example output from this site could looks like the following:
| Peak Concurrency | Total Users | Active Users 1+ Sessions | Active Users 5+ Sessions |
|---|---|---|---|
| 2 | 10 | 7 | 4 |
Note
The Licenses Allocated Unused metric found here is calculated on 30 days, not 90, as the above chart shows. Take this into consideration in the capacity plan.
Tags
#capacity_plan
#users
#operations_monitor