Analyze Data Connections
Cadence Monthly
Sites developmentproduction
| Initial | Recurring | |
|---|---|---|
| Estimated Time | 20 min (+ long initial reload) | 10 min |
Benefits:
- Map data connections to owners
- Track data connection usage
- Enable auditing
- Allow for elegant data connection deprecation
Goal
There are numerous goals to managing and curating data connections in a Qlik site – especially in a development tier, where potentially many, many power users are creating data connections. In essence, the goal is to run a leaner, more performant, and more easily and holistically governed Qlik Sense site.
In this section, there will be a How-to and an Action section for each of the commonly asked questions about data connections.
Table of Contents
- Prerequisite
- Which connections are no longer used?
- What connections have never been used?
- Where are data connections being used?
- Do we have duplicate data connections?
- What connections have been deleted that used to be used?
- What are the most widely used data connections?
- Who is using what data connections?
- Via what mechanism are data connections being used?
Prerequisite
Data Connection Analyzer
This pages leverages the Data Connection Analyzer application. For documentation, please refer to Data Connection Analyzer. To understand why this tool is needed for this process, please refer to the Data Connection Usage section of the Remove Unused Data Connections article.
Which connections are no longer used?
A data connection is found in a script log and the data connection exists in the Qlik Sense site, however, the applications which refer to this data connection in their scripts no longer exist.
It is common for data connections to become deprecated or unused over time. A data source may change from one database to another. Or perhaps the need for the data source no longer exists. By leveraging this app, one can identify which connections have been used inside of Qlik apps but those Qlik apps have been deleted / no new Qlik apps use this data connection.
How-to
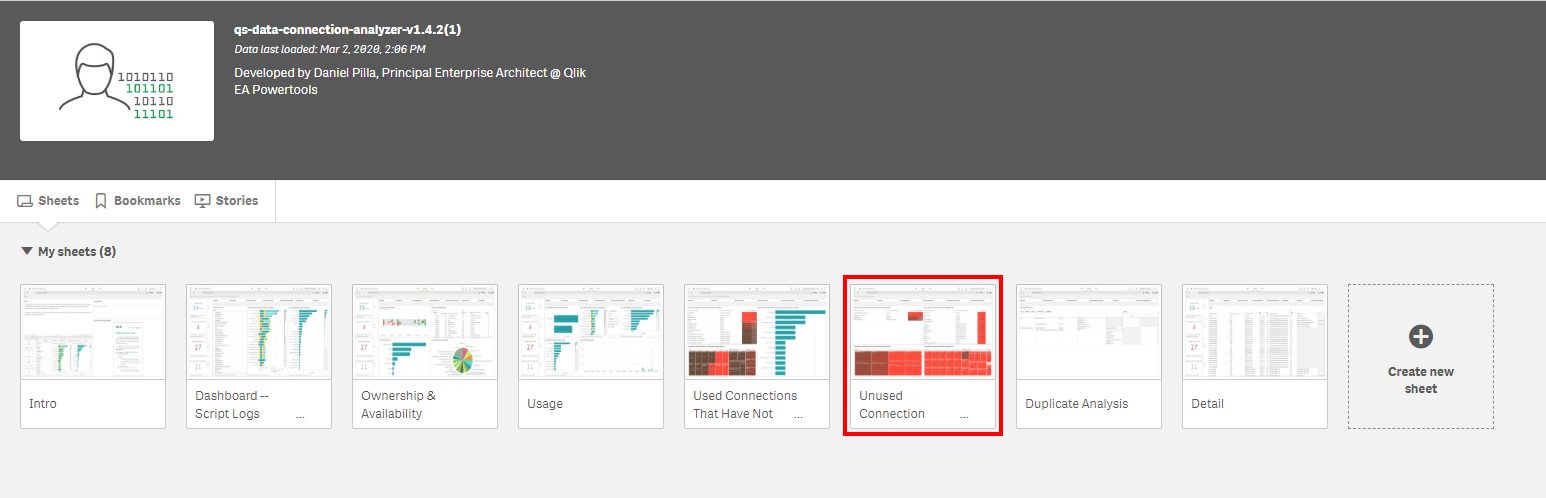
Navigate to the Unused Connection Analysis sheet.
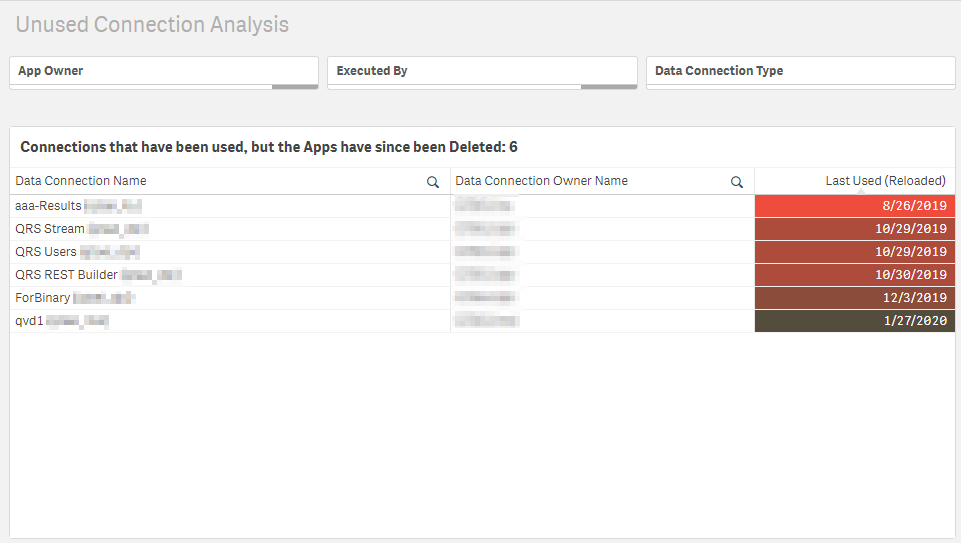
If there are any connections that fall into this category, they will appear in the Connections that have been used, but the Apps have since been Deleted: X table. In the example here, there are 6.
Action
If the data connection Last Used (Reloaded) date is over 90 days old (or whatever is the desired age of a connection to be unused organizationlly), contact the owner of the data connection to see if it can be quarantined and then ultimately removed. Please refer to the Suggested Actions section of the Remove Unused Data Connections article.
What connections have never been used?
A data connection exists in the Qlik Sense site, but no reference exists to it in any script log.
It is common that users will create data connections to test connectivity, but then never actually use them. By leveraging this app, one can identify connections that have never been used and have existed for x amount of time (say 90+ days), so that action can be taken to remove them.
Note
The Data Connection Analyzer app leverages a variable named vNumLogDays in the script to specify how many days worth of logs the app should parse. If this variable is modified from its default value of 9999 then it is possible that the data connection was used but outside of the specified vNumLogDays and thus be considered unused by the Data Connection Analyzer. If the goal is to get a more accurate read here, ensure that vNumLogDays is set to capture all logs, with a value of 99999.
If old Archived Logs are being archived (refer to: Archive Old Archived Logs) then that needs to be taken into account as well, as those script logs will not be analyzed. Typically, this is perfectly acceptable, as those script logs are usually quite old, and if a connection hasn’t been used since then, it is safe to say it is unused and can be removed.
How-to
Navigate to the Unused Connection Analysis sheet.
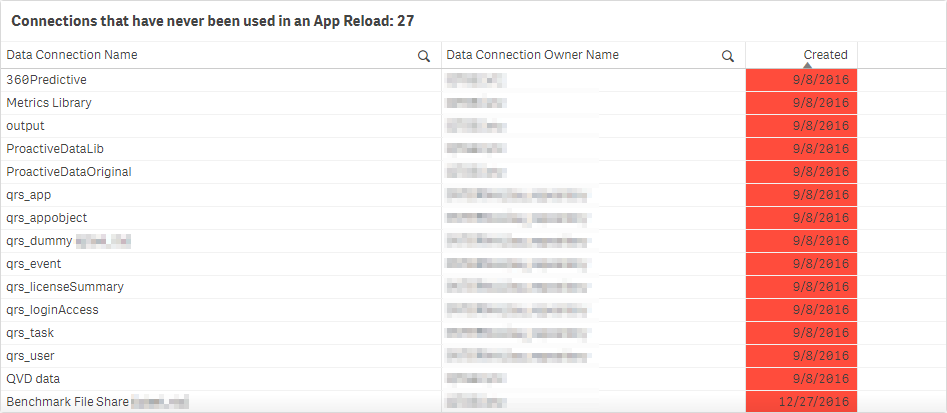
If there are any connections that fall into this category, they will appear in the Connections that have never been used in an App Reload table. In the example here, there are 27.
Action
If the data connection Last Used (Reloaded) date is over 90 days old (or whatever is the desired age of a connection to be unused organizationlly), contact the owner of the data connection to see if it can be quarantined and then ultimately removed. Please refer to the Suggested Actions section of the Remove Unused Data Connections article.
Where are data connections being used?
Let’s say a data source is being transformed and will be moved from one database to another location. The first question one might ask is, “What applications are using that connection, so we can re-route it to the new db and make adjustments to the load scripts?”. This historically has not been easy to answer. This application allows one to select that connection and visualize apps that are using it.
How-to
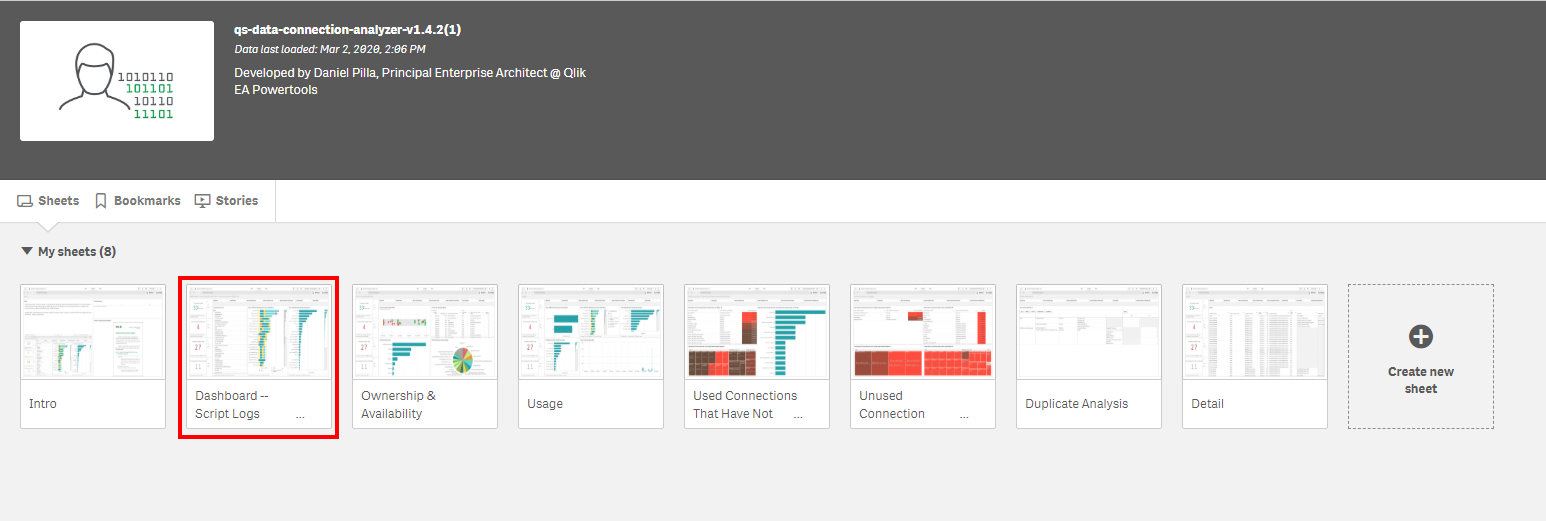
Navigate to the Dashboard sheet.
Select True next to the Connections Used KPI to select all used data connections.
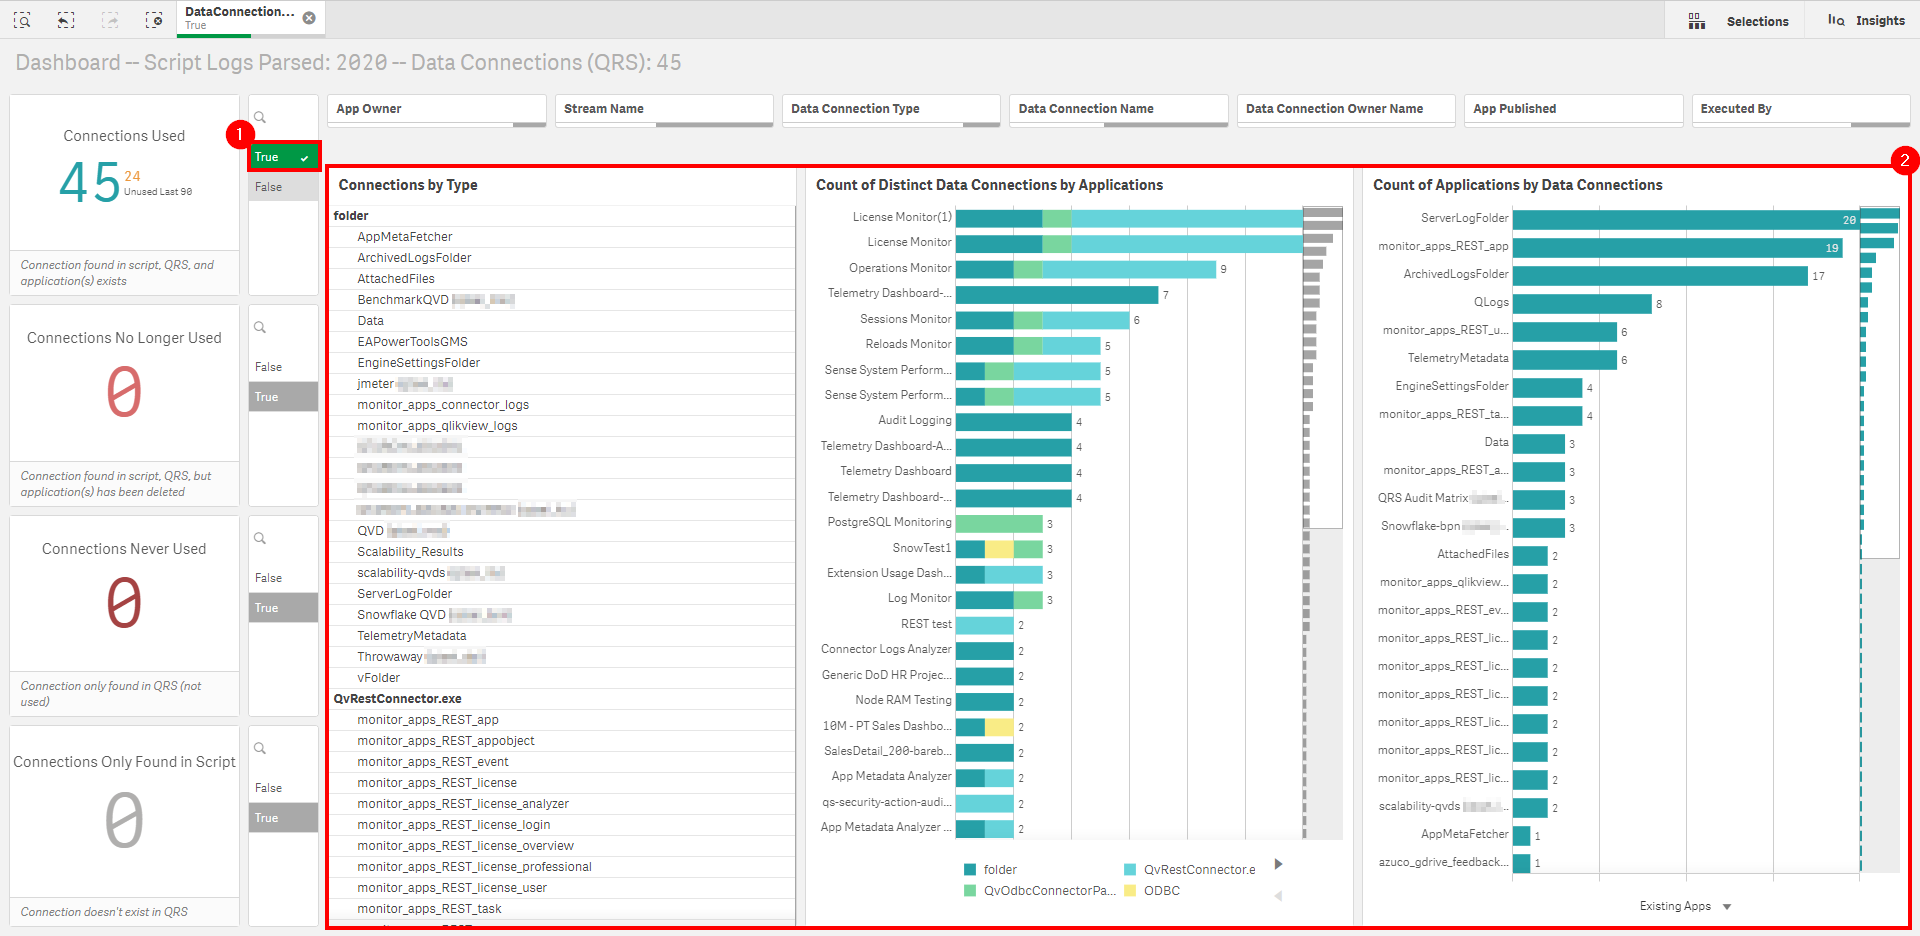
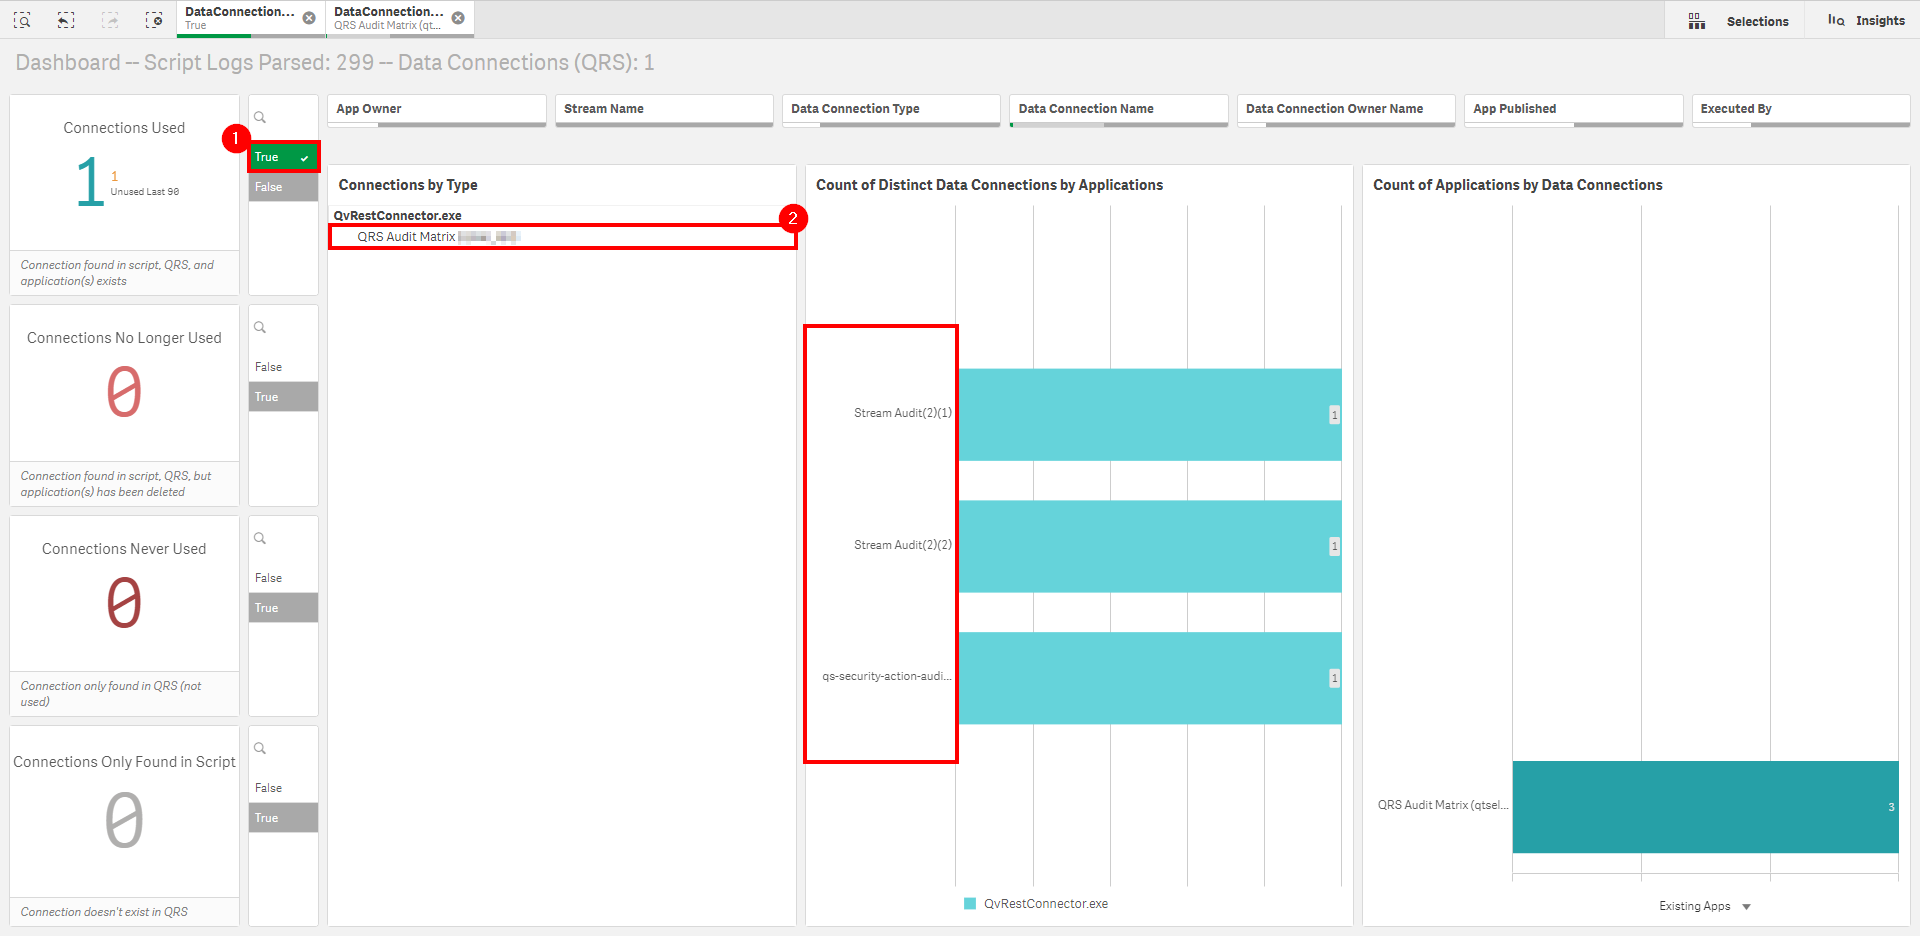
Select a single data connection to visualize all of the applications that are dependent on it.
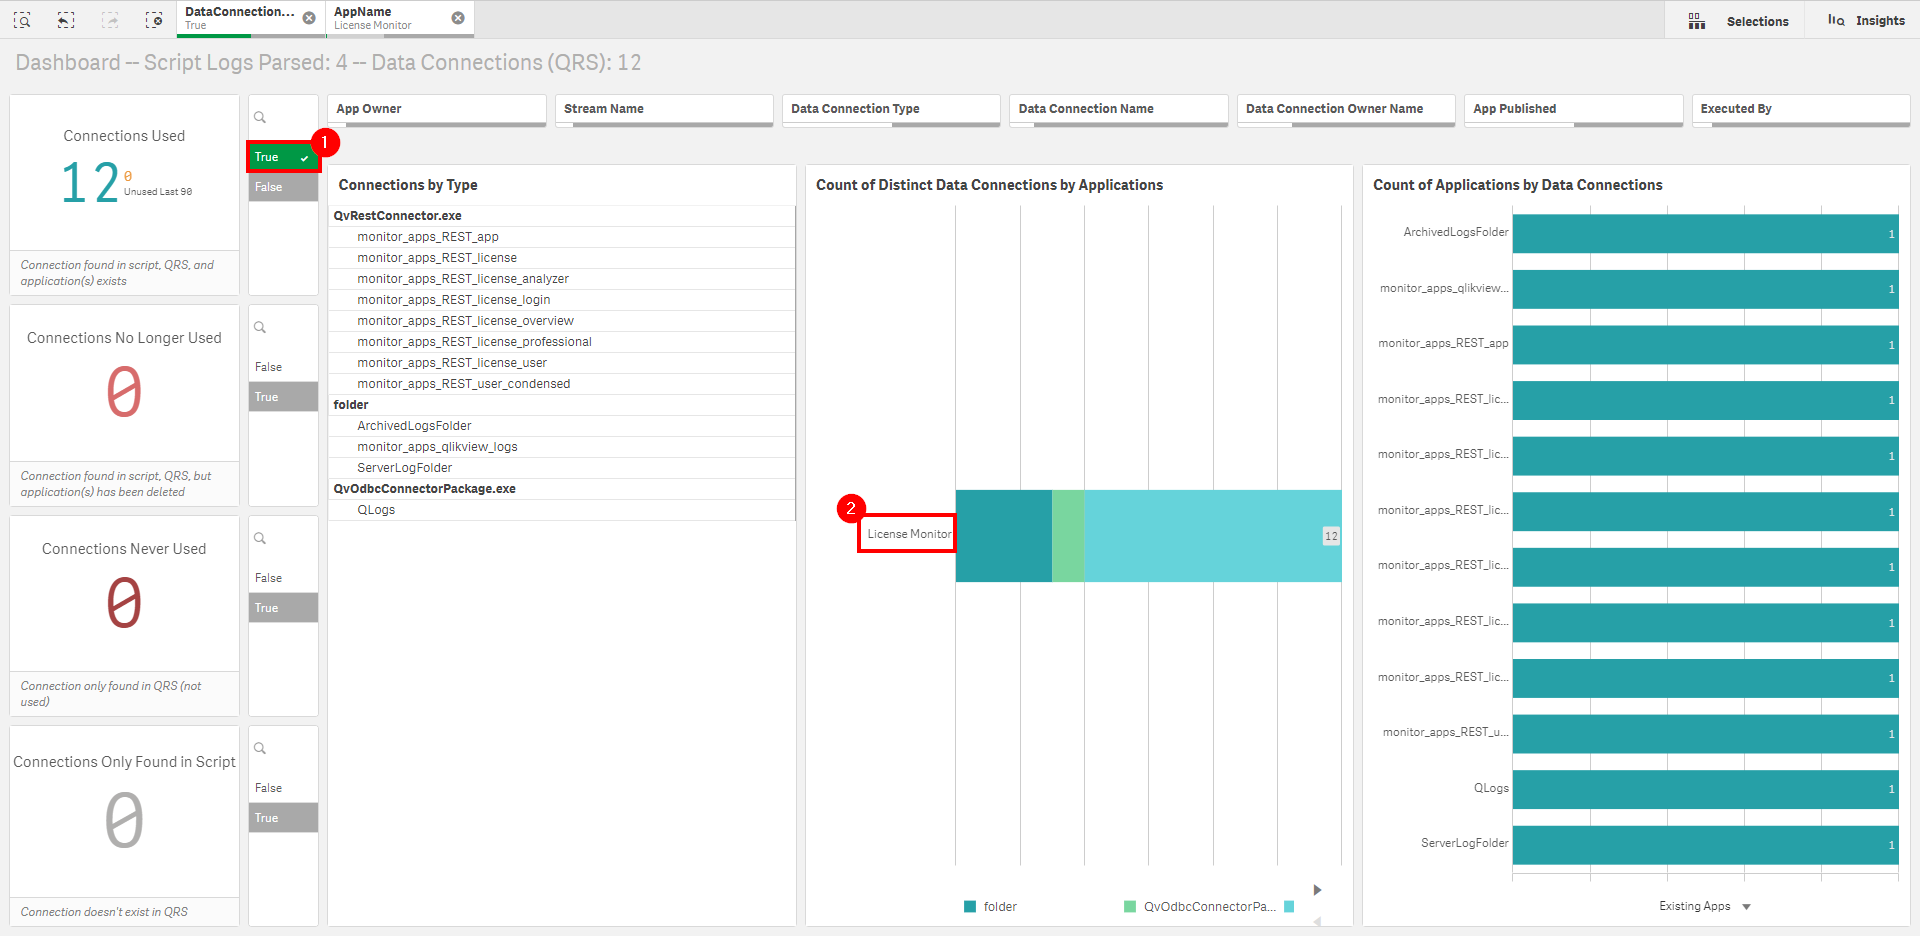
Optionally, select a single application to view all of the data connection dependencies for a specific application.
Action
If a data connection is being deprecated, or re-routed, etc–ensure that the process above of identifying all of the applications that are dependent on that data connection is followed, so that the new connection details can be addressed in each of the application’s load scripts.
Do we have duplicate data connections?
By analyzing the connection strings, one can tackle duplicate connections to the same source data. This eases administration overhead and will ensure that there is reusability/consistency across the platform.
How-to
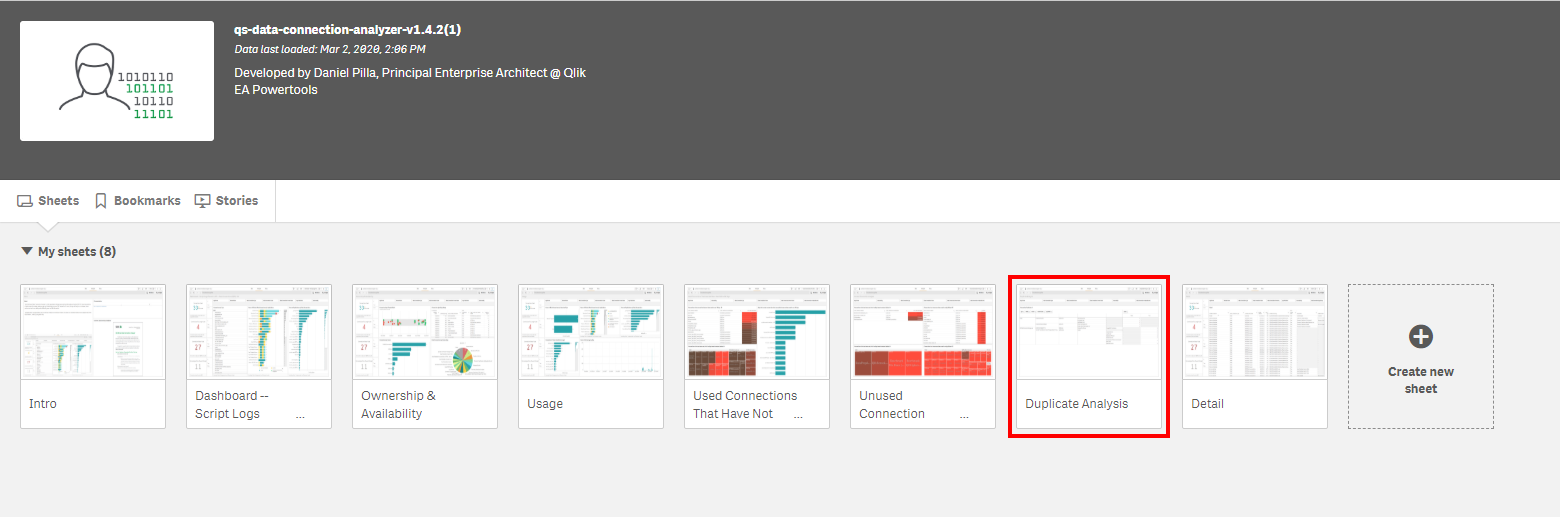
Navigate to the Duplicate Analysis sheet.
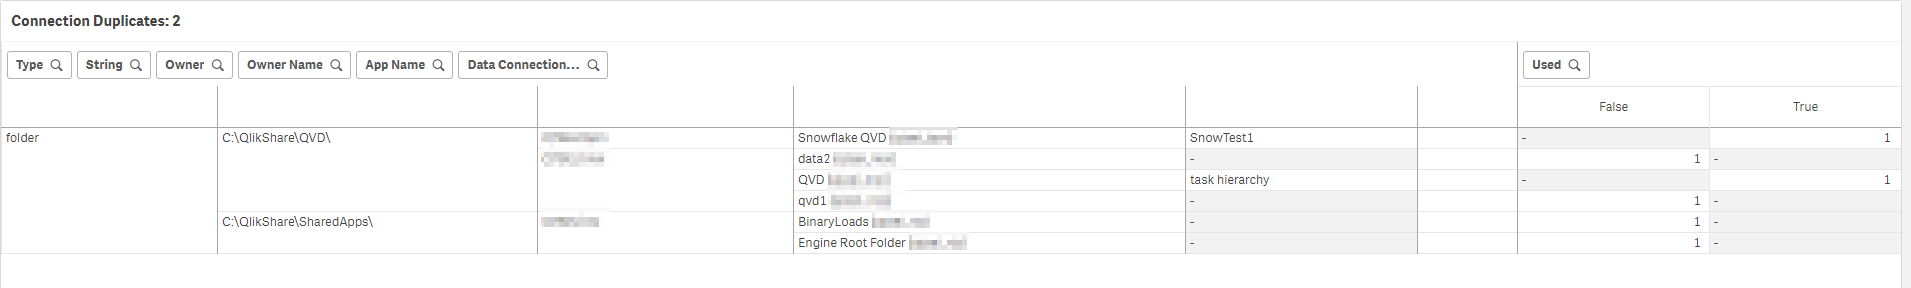
In this example, the type of Folder connection has been selected, and it is visible that there are 2 folder connection duplicates. From the below we can tell that:
- The
C:\QlikShare\QVD\connection- Has four duplicates across two different users.
- Is leveraged by two applications.
- The
C:\QlikShare\SharedApps\connection- Has two duplicates across a single user.
- Isn’t leveraged by any application.
It is very likely that these folder connections point to different subfolders within.
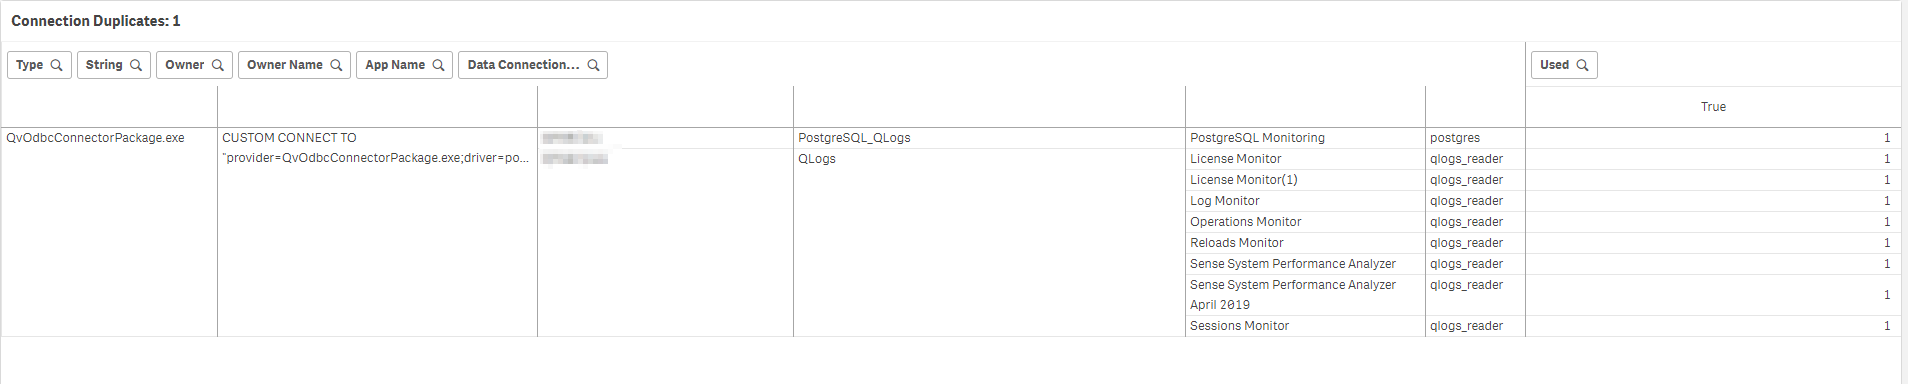
Now, in the following example, the type of QvOdbcConnectorPackage.exe has been selected, and it is visible that there is a single ODBC connection that has a single duplicate. It is also visible that the connection has a different username–which is common across ODBC connections to ensure database security for individual users where passthrough auth is not an option.
Action
Connection duplicates should be resolved where possible. Contact the owners of the applications, and audit which applications are using them. Decide which connections should become the primary with the developers, and ensure that they are all moved to that new connection and tested.
What connections have been deleted that used to be used?
By parsing the script logs, one can visualize old data connection names/paths that can help to serve as an audit trail.
How-to
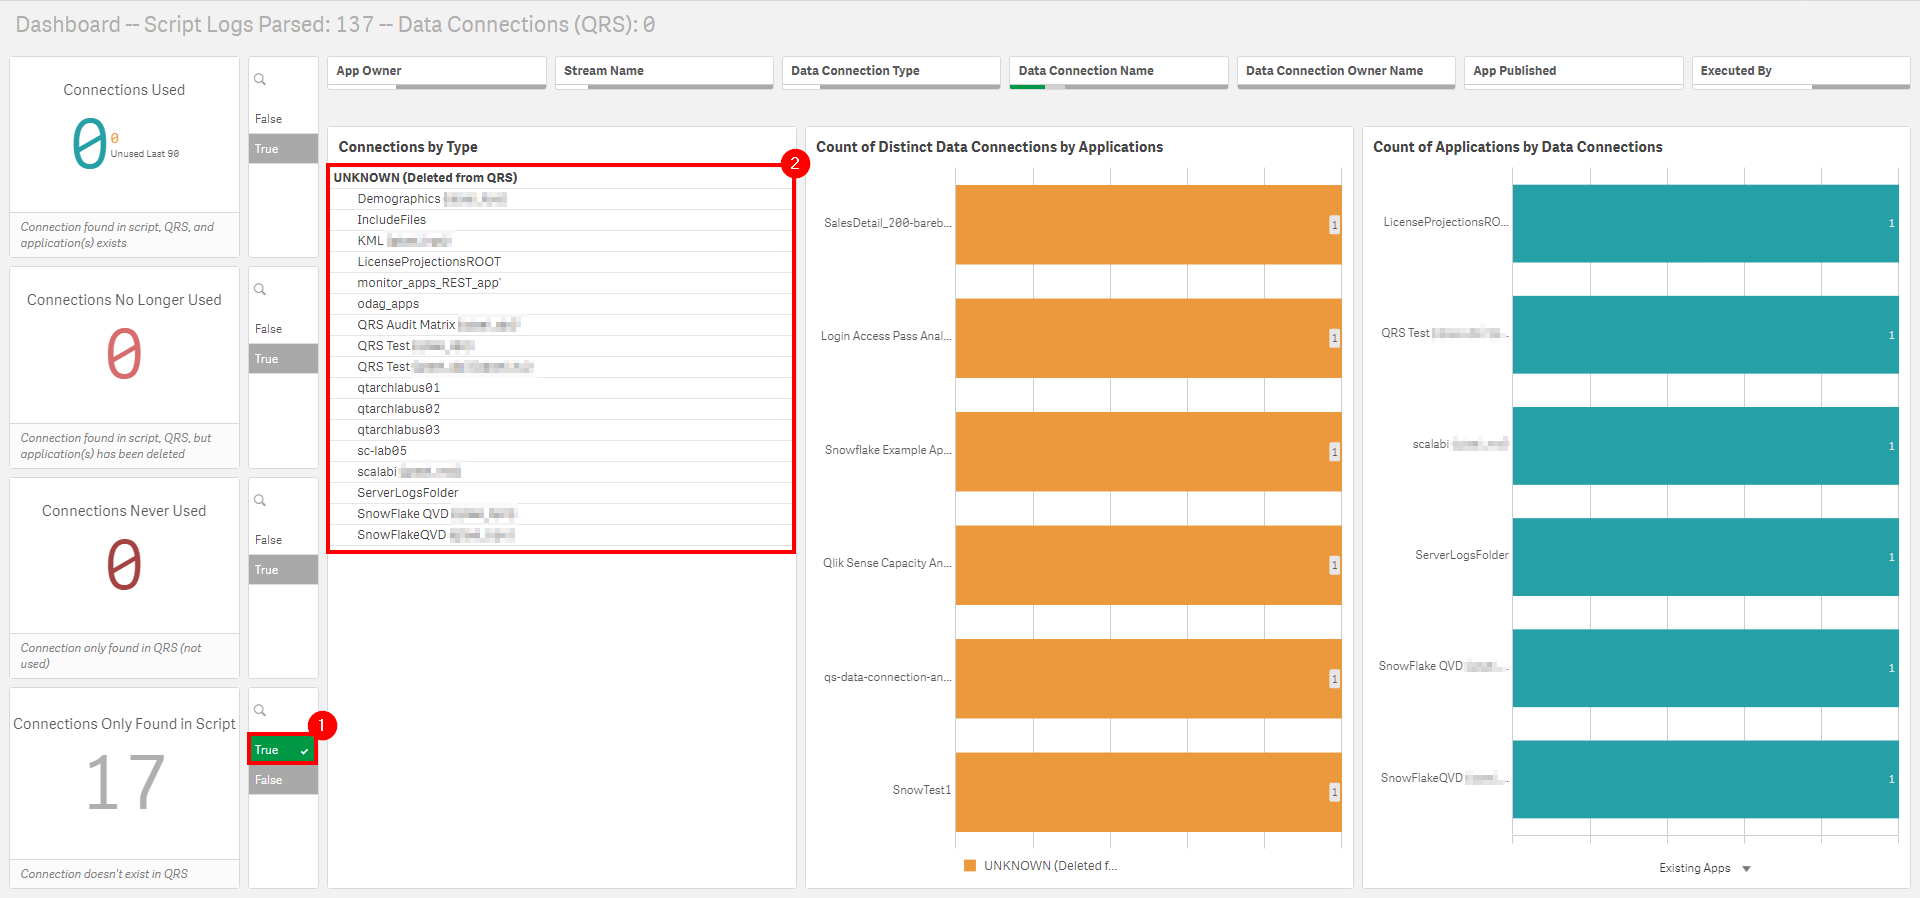
Navigate to the Dashboard sheet.
Select the value of True next to the Connections Only Found in Script KPI. The Connections by Type object will now show all of the connections that were found in script log files, but were not found in the QRS.
Action
There is no direct action necessary here, as this exercise is only particularly useful in the context of auditing. Leverage as required.
What are the most widely used data connections?
Depending on how this application is deployed, whether it be strictly administrative or potentially visible to developers, this metric is important both administratively and socially throughout the organization.
How-to
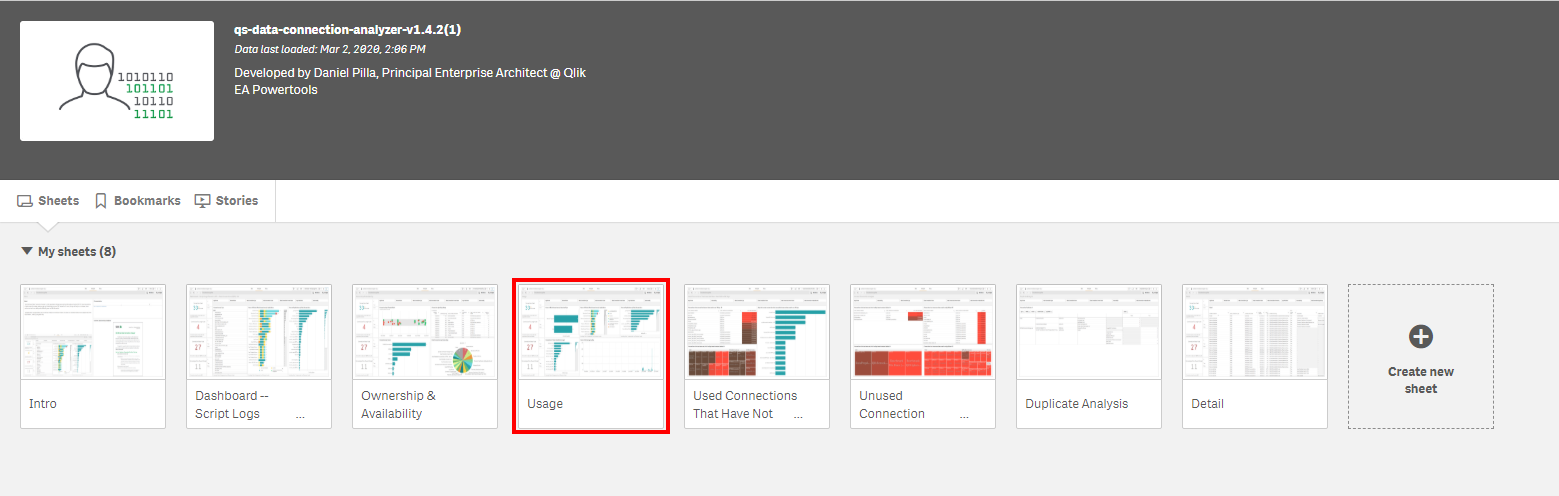
Navigate to the Usage sheet.
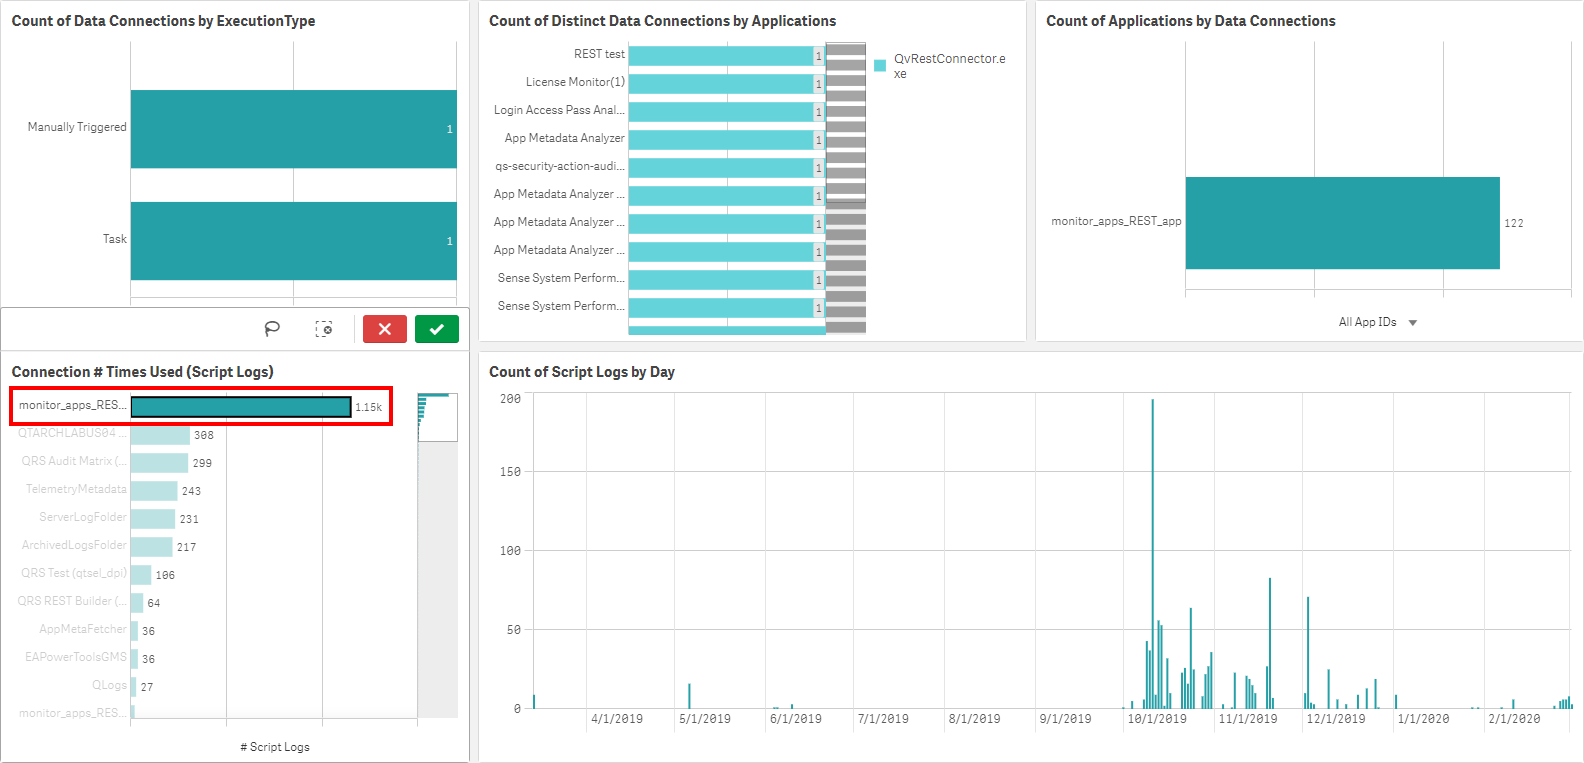
Locate the Connection # Times Used (Script Logs) table. This table visualizes the amount of script logs that each connection is found in.
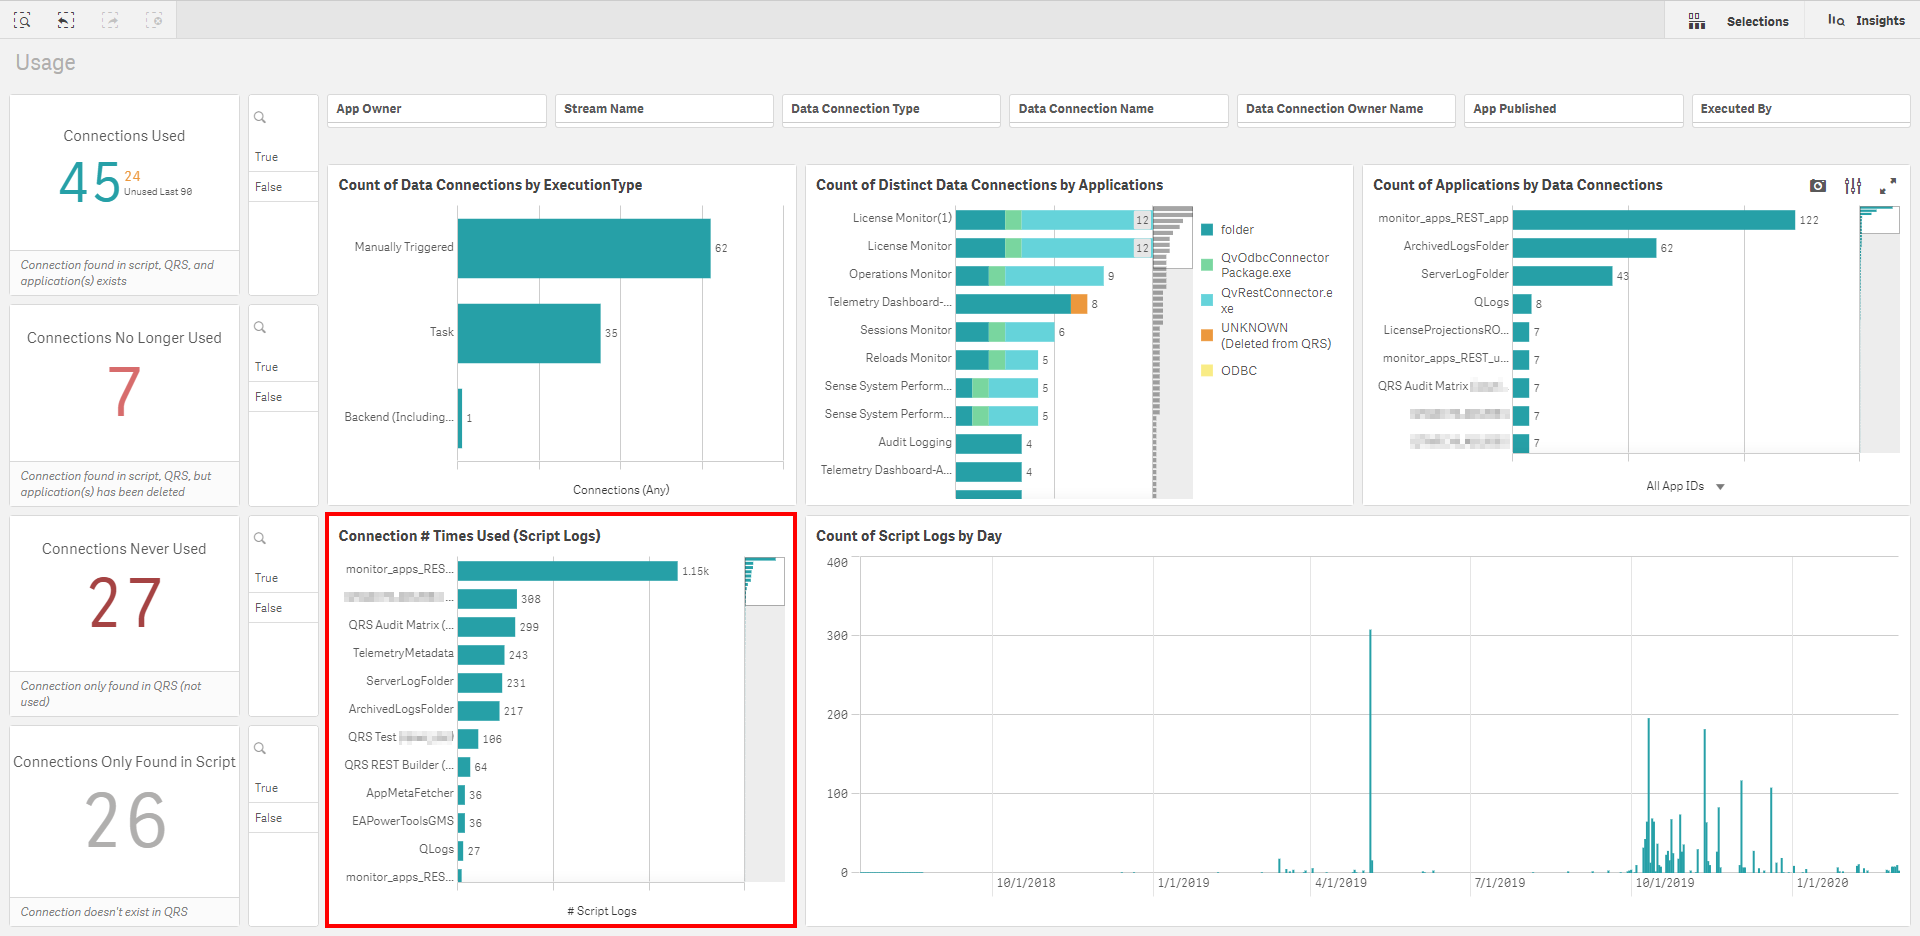
Select a connection, and visualize the what applications utilized it and when–as well as by what execution type (Task, Manual, API).
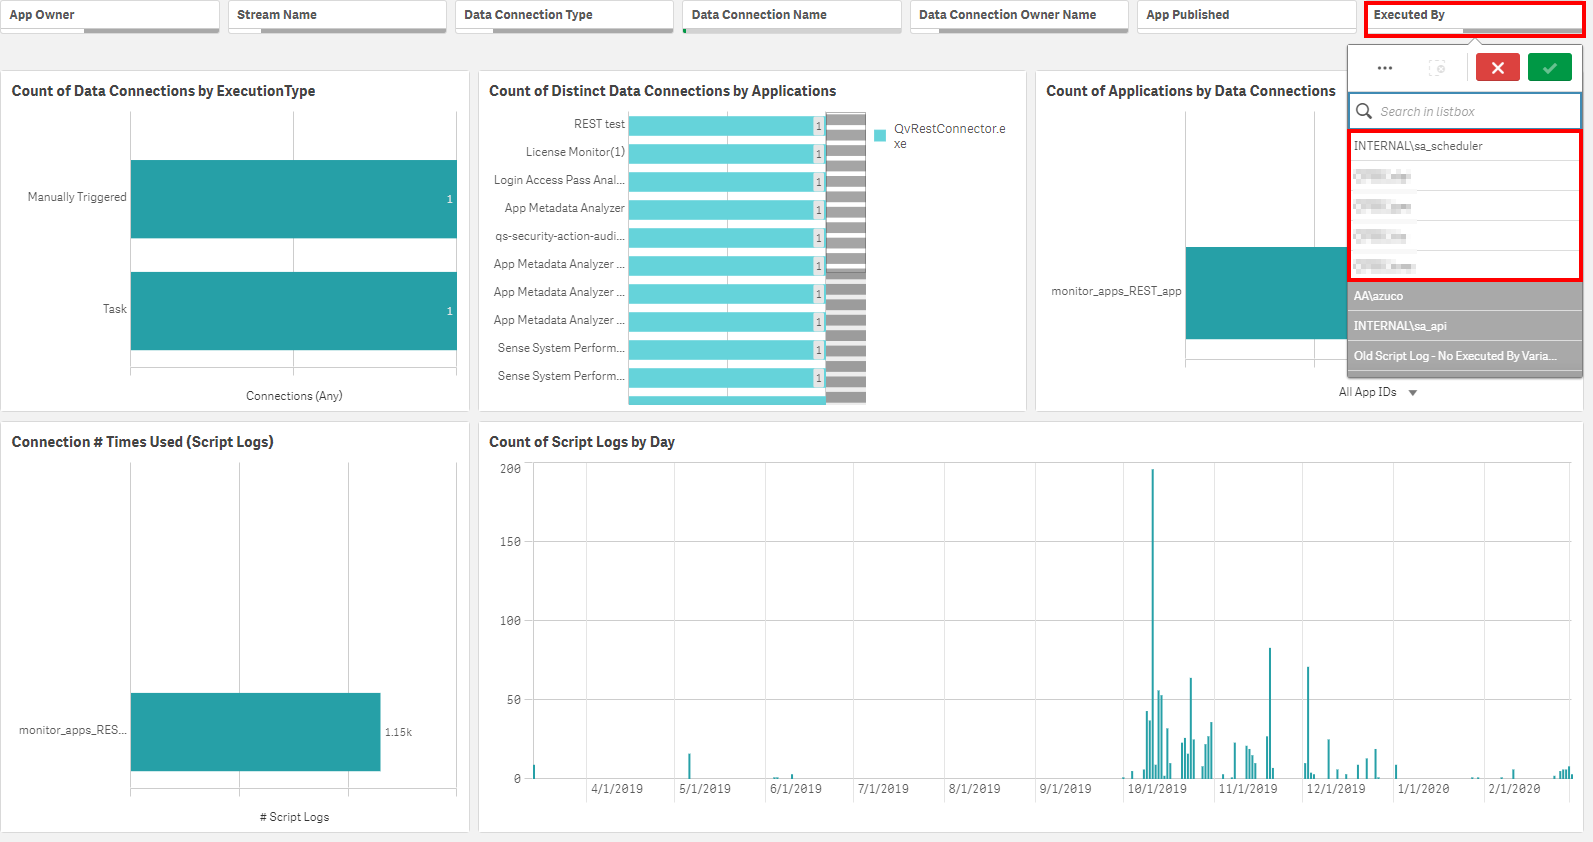
In the upper right, one can then select the Executed By filter to visualize what users have leveraged the data connection.
INTERNAL\sa_schedulermaps to Task executionsINTERNAL\sa_apimaps to API (ODAG or otherwise) executions- End-user accounts map to Hub executions
Action
There is no direct action necessary here. Leverage as required.
Who is using what data connections?
While “User A” might own “Data Connection A”, “User B” might also have read access to that data connection. This can of course be visualized through the audit capability of the QMC, however this application will physically reveal who is executing any reloads of those data connections, giving greater visibility and allowing a deeper level of auditing and governance.
How-to
The process to answer this question is addressed in the What are the most widely used data connections? section above, and can be achieved by navigating to the Usage sheet and filtering on the Executed By filter.
Action
There is no direct action necessary here. Leverage as required.
Via what mechanism are data connections being used?
The application visualizes what connections are being run as tasks, manually, or in ODAG (or other API) requests. This is crucial in understanding user behavior.
How-to
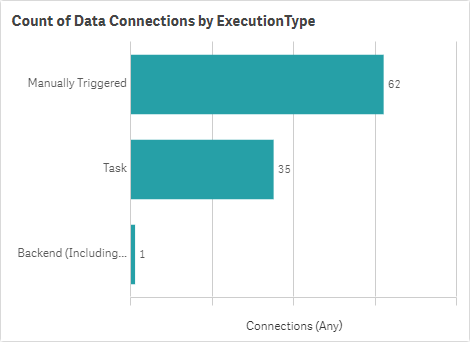
The process to answer this question is addressed in the What are the most widely used data connections? section above, and can be achieved by navigating to the Usage sheet and filtering on the ExecutionType filter within the Count of Data Connections by ExecutionType table.
Action
There is no direct action necessary here. Leverage as required.
Tags
#monthly
#asset_management
#data_connections
#data_connection_analyzer