Review/Optimize QVDs
Cadence Quarterly
Sites developmentproduction
| Initial | Recurring | |
|---|---|---|
| Estimated Time | 2 hrs | 15 min |
Benefits:
- Reduce Maintenance
- Increase Data Consistency
Goal
The goal here is to identify and remedy inefficiencies and overlaps in QVD files, as well as detecting anomalies that could point to reload logic issues or unplanned spikes in growth/capacity.
Note
This exercise does not refer to optimizing QVDs in the traditional sense of optimizing their read-time, but rather optimizing the QVD inventory.
Prerequisite
Qlik Sense QVD Monitor
This pages leverages the Qlik Sense QVD Monitor application. For documentation, please refer to QVD Monitor.
Exercise
Assumptions
- Qlik Sense QVD Monitor application is configured
- Application is published to the Monitoring apps stream
- Daily reload task
- *Preferably greater than 14 days worth of data, so that trends are visible
Process
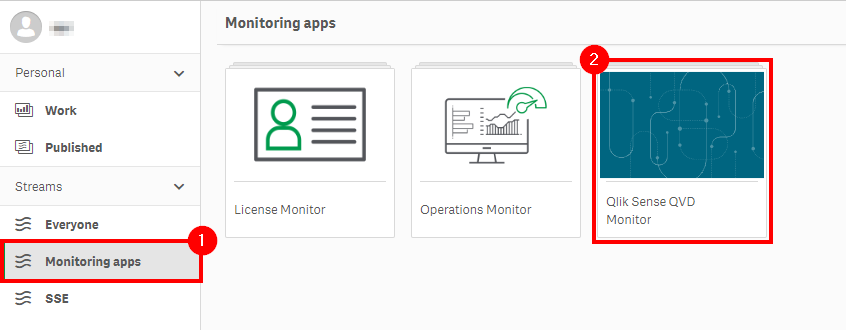
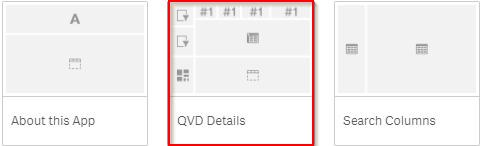
Open the Qlik Sense QVD Monitor application, and then select the QVD Details sheet.
Priority 1
Note the overall metrics at the top of the sheet, and ensure that all of the QVD folders are reflected in the QVD Growth Rates table.
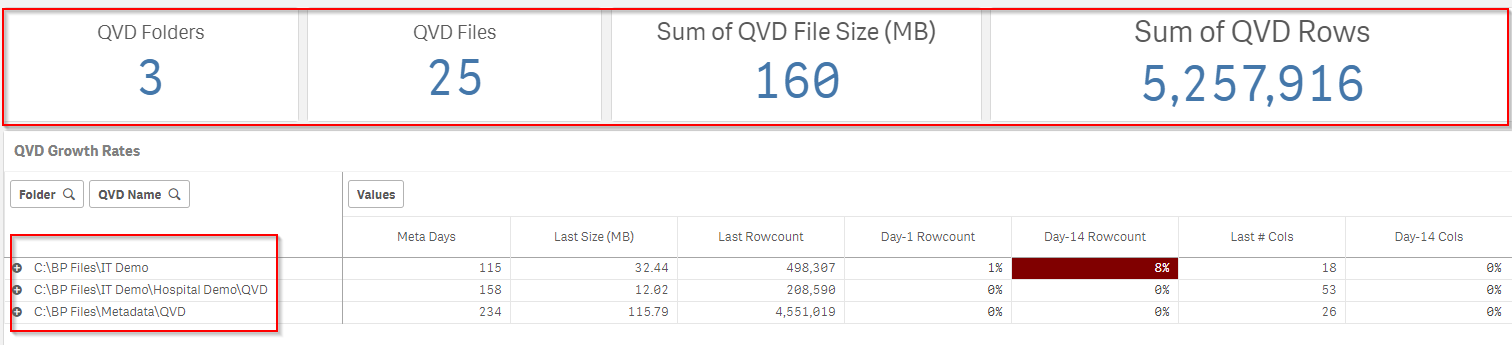
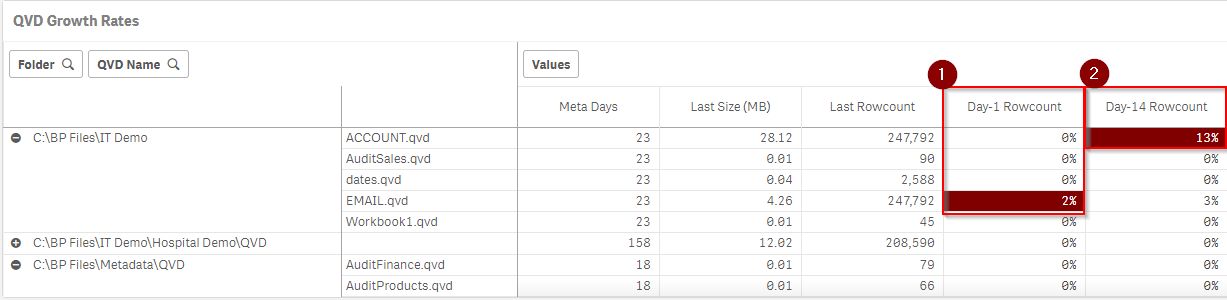
Priority 2
Look for anomalies in the growth rates (pos or neg) of the QVD files. These will be highlighted in red, and the pivot table may need to be expanded in order to see them.
Note
The default thresholds can be modified in the load script.
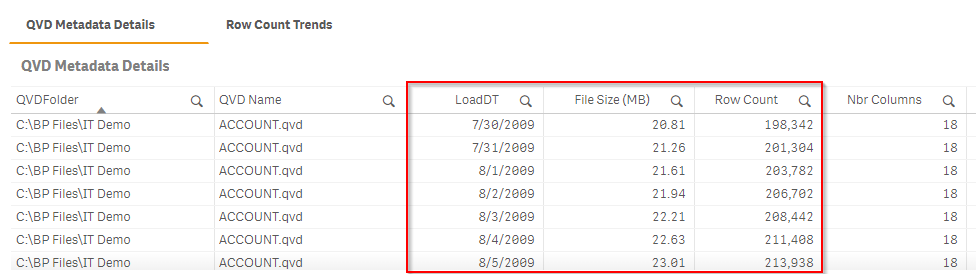
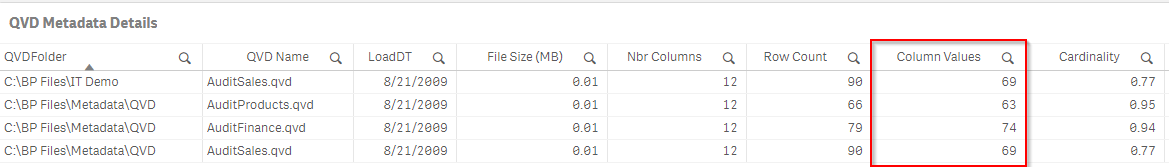
When the goal is to examine growth by day and any trending of a QVD, display the QVD Metadata Details table at the bottom of the sheet (the first of two objects in the container).
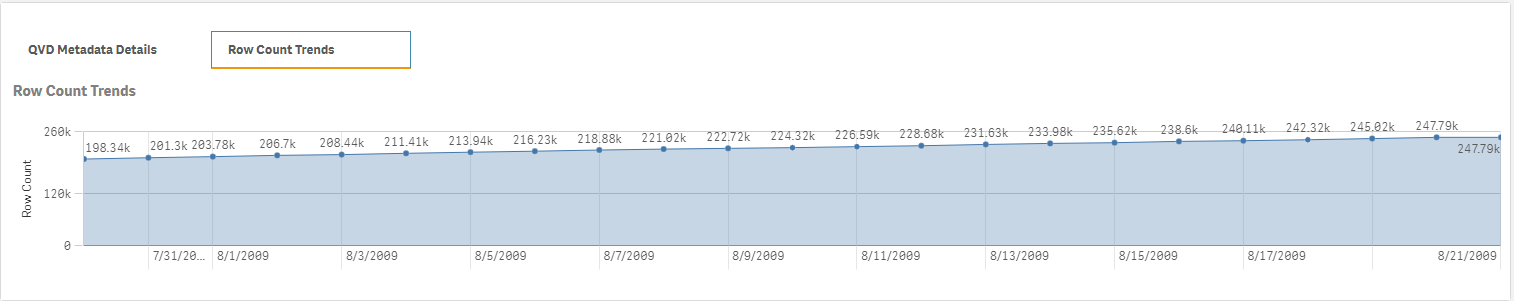
It is also suggested to view the row count trends of the same QVD in the second object in the container, named Row Count Trends.
Decisions on whether or not a growth trend is “normal” or “anomalous” are up to the organization. However, in general it is considered a best practice that negative growth is typically something that should be justified, and spikes in growth or irregular growth should also be validated. For those situations, it is best to open the application that builds the QVD in question (QVD generator typically) and/or speak with the developer responsible. It could also be tied to a recent logic change, or source change, and, in that case, should also be validated.
Priority 3
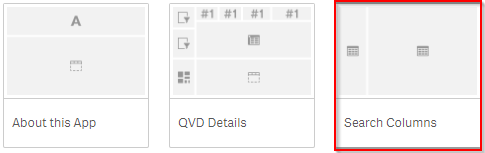
Navigate to the Search Columns sheet in the application.
In the Column Occurrences table on the left side of the sheet, a complete list of QVD columns is visible, with the number of occurrences that each column name has across all QVDs. Note that this table only contains the most recent QVD load of all QVDs.
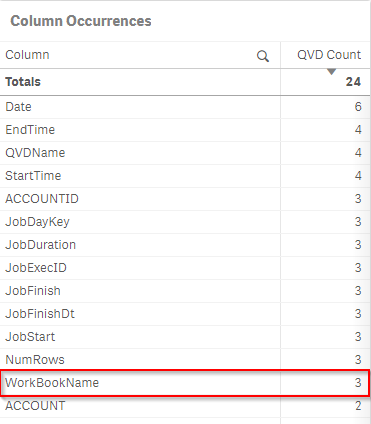
Select a column in this table to filter the main table down, and view the details about the QVDs that contain that column name. This is critical to ensure that the same column is not being used with either different source data, or logic that produces materially different values across QVDs for the same column. When this happens, it can cause confusion amongst developers/designers/users, and it can cause inconsistencies across apps. Refer to the example below where WorkBookName was chosen, and the resulting QVDs that contained that column had differing numbers of unique values for that same column. This could be an inconsistency that should be investigated further.
Priority 4
“QVD Overlap” is a term for when many column names from two or more QVDs overlap heavily, say 50% or more. Sometimes this is done by design, for example, having a summary and detail version of the QVD can be great for performance, and having segmented QVDs for large datasets is in fact considered a best practices. However, when it is unintended that QVDs greatly overlap each other or are duplicates of each other, it could imply extra reload work, storage bloat, extra maintenance, and could cause confusion among developers, designers, and users.
Navigate to the QVD Overlap sheet.
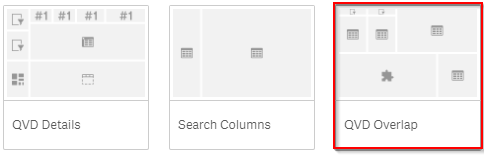
In the Source → Target Overlap table on the right, find and select QVDs that have a large percentage of overlap with other QVDs.
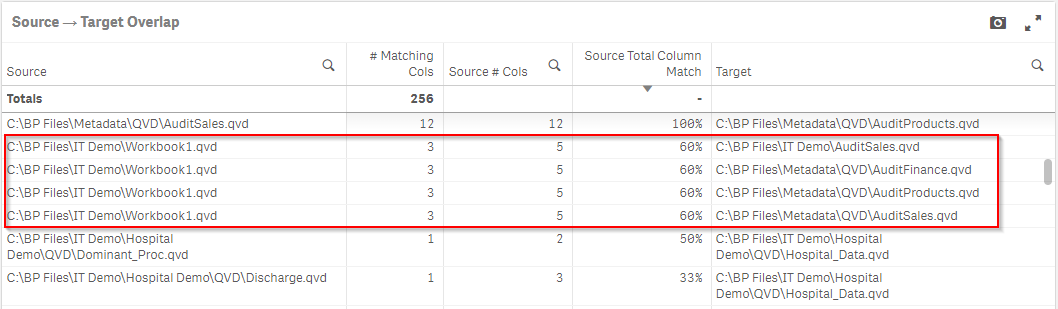
Then individually select the Target QVDs to see the column overlaps between the QVDs.
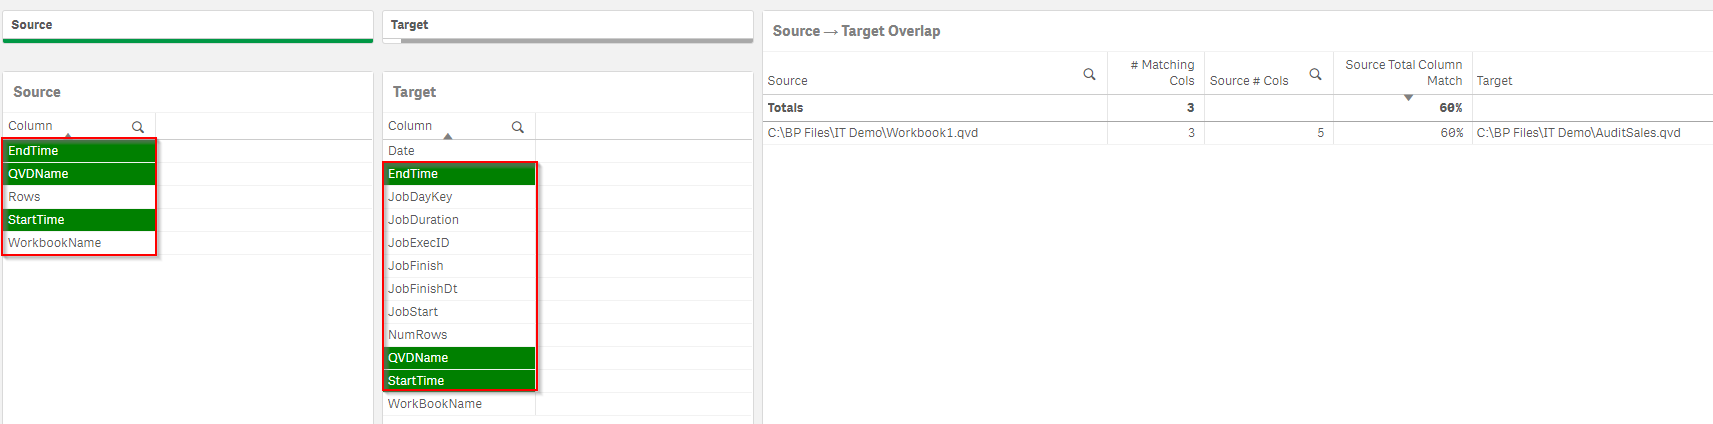
Analyze the overlap to determine whether or not it is something to react to. For example, if the two QVDs have a 95% overlap, and they are the same granularity of data, this may be duplicative work and might be confusing to your Qlik Sense developers. It may also result in inconsistencies down the road, if the QVDs get differing logic in how they are loaded. Though, this can occur if new fields are added to QVDs that are written out monthly. Naturally, as new fields become added, they will begin to differ–which is natural.
Tags
#quarterly
#asset_management
#qvds
#qvd_analyzer