Optimize Sheet Order for Adoption
Cadence Quarterly
Sites production
| Initial | Recurring | |
|---|---|---|
| Estimated Time | 1 hr | 15 min |
Benefits:
- Increase adoption
- Improve focus
Goal
This supports both the administrator and the application owner in optimizing application the order of sheets, supported by usage data.
When an application is developed, the sheets are ordered in a logical flow . For example the Dashboard, Analysis, Reporting (DAR) methodology , which recommends flowing data from high-level down to the detail. When considering re-ordering sheets, ensure that this methodology isn’t lost if already in place.
It is integral to combine the usage data with the logical flow to make sure that the new sheet order will increase adoption rates and BI effectiveness.
This activity should not be attempted for every application, and should be prioritized to highly-used applications. Refer to Analyze App Adoption for guidance on qualifying which applications are most used.
Table of Contents
- Suggested Prerequisites
- Audit Activity Log
- Operations Monitor
- Select Applications with a High and Low Number of Sessions
- Analyze Application Sheet Adopion
- Reorder Application Sheets
Suggested Prerequisites
Audit Activity Log
As of the February 2019 release, an improvement was added to the product to log sheet usage at default log levels. This enables the ability to measure sheet adoption as well as manage the amount of sheets in the applications–keeping them trimmed to only what is being leveraged.
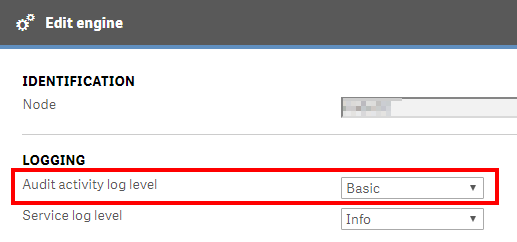
Ensure that the Audit Activity log level is set to Basic for every engine.
Note
This is the default setting, but it is encouraged for the Qlik administrator to confirm what is configured for their environment(s).
Operations Monitor
This page leverages the Operations Monitor. Please refer to the Operations Monitor page for an overview and relevant documentation links.
Confirm Operations Monitor is Operational
Navigate to the Monitoring apps and select the Details button (info icon) on the Operations Monitor application. Confirm that the application’s data is up-to-date.
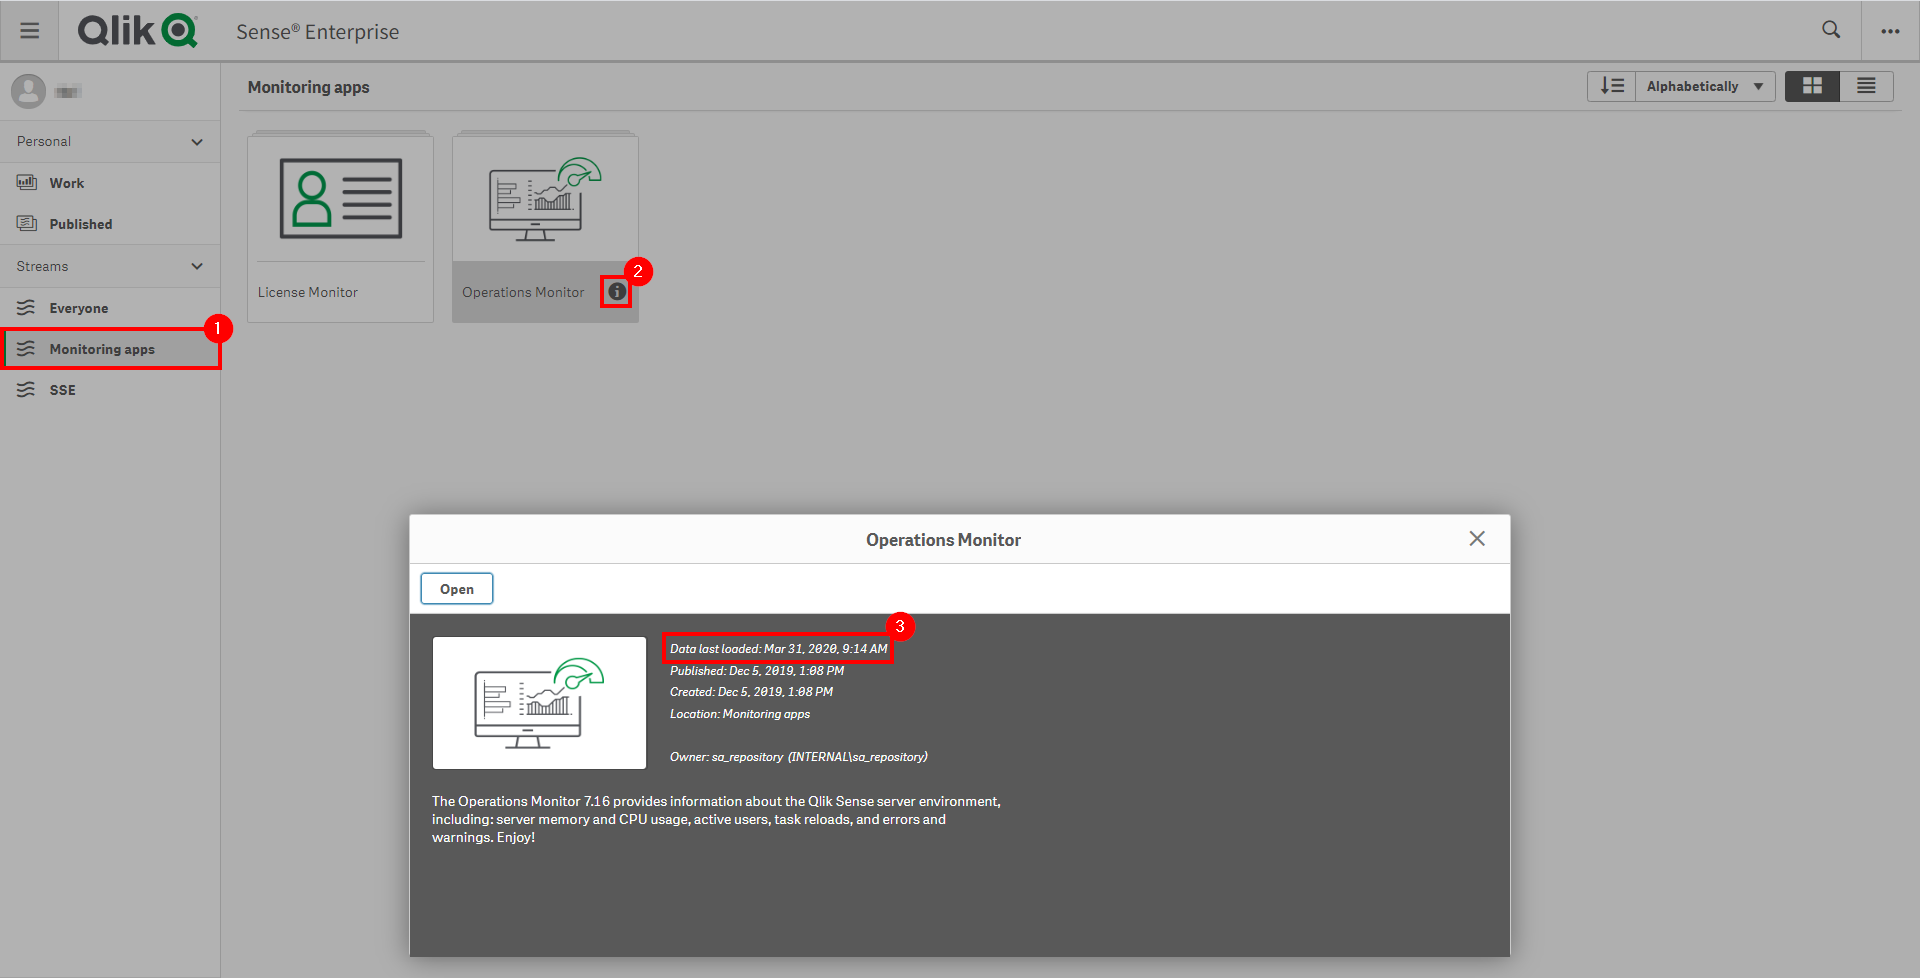
If the Operations Monitor is not up-to-date, please refer to the Operations Monitor Documentation for configuration details and troubleshooting steps.
Select Applications with a High and Low Number of Sessions
Before analyzing the sheet usage data, it is a good practice to select specific applications to analyze. It is recommended that the Qlik administrator starts with the top five applications with the highest number of sessions.
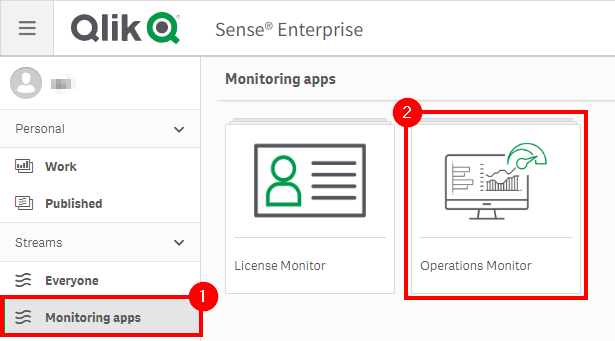
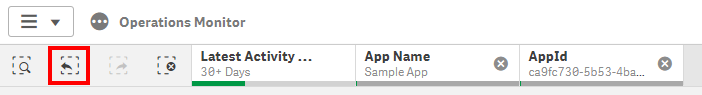
Open up the Operations Monitor application, inside of Monitoring Apps stream.
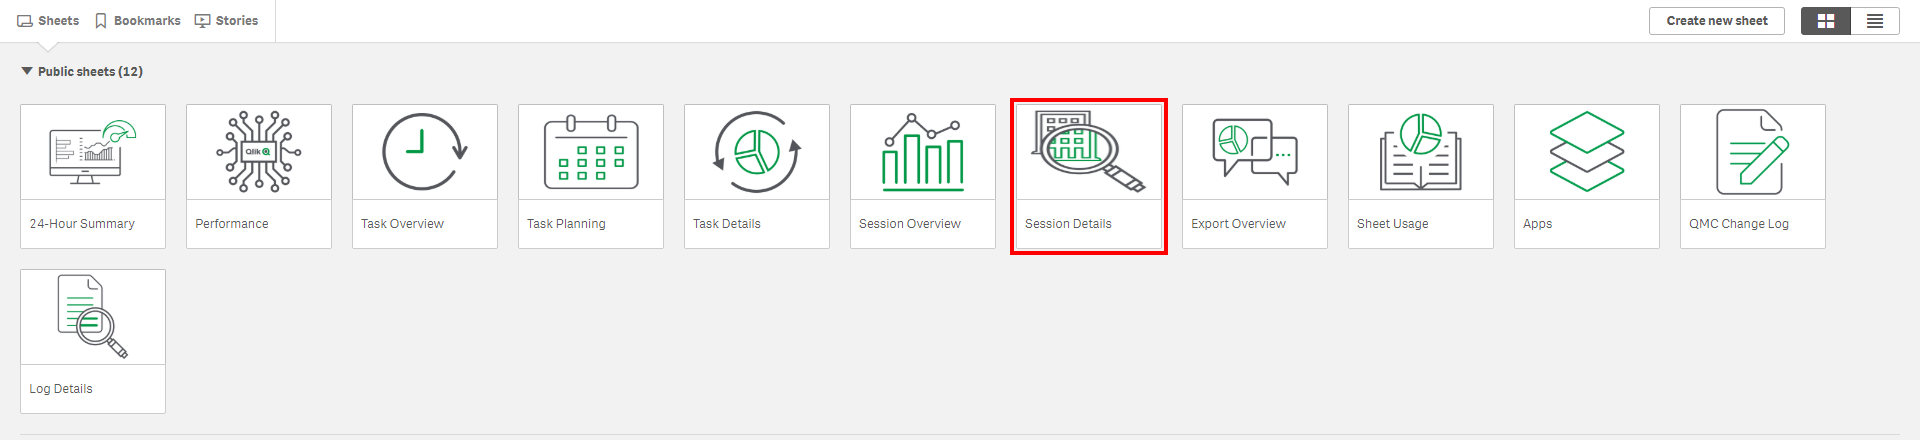
Open the Session Details sheet.
In the App Session Summary table, sort the Sessions column descending.
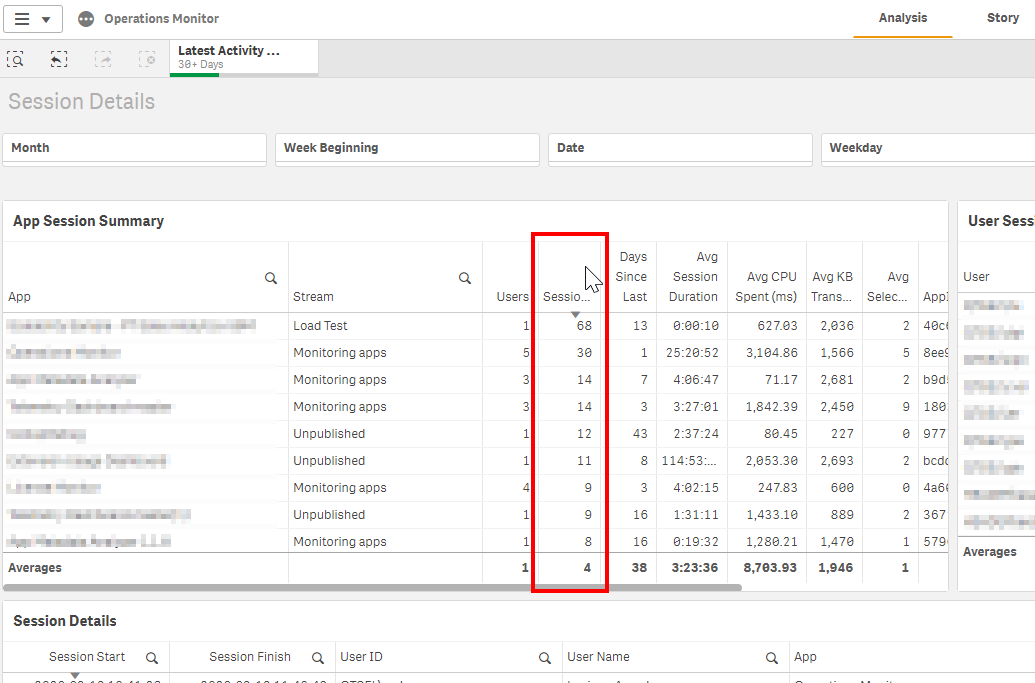
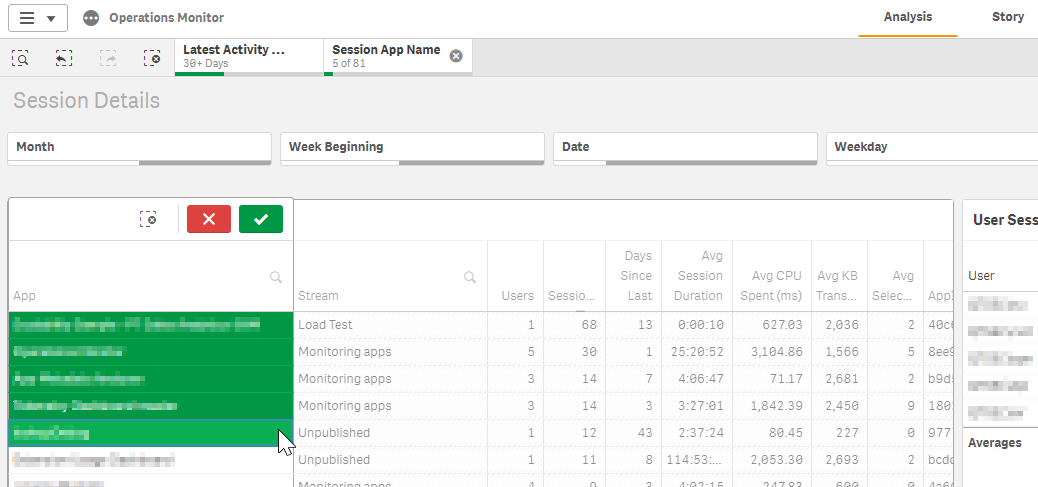
Select the top five applications.
Analyze Application Sheet Adopion
After selecting the top five applications in the previous step, the next step is to take a look at the sheet usage data for each application.
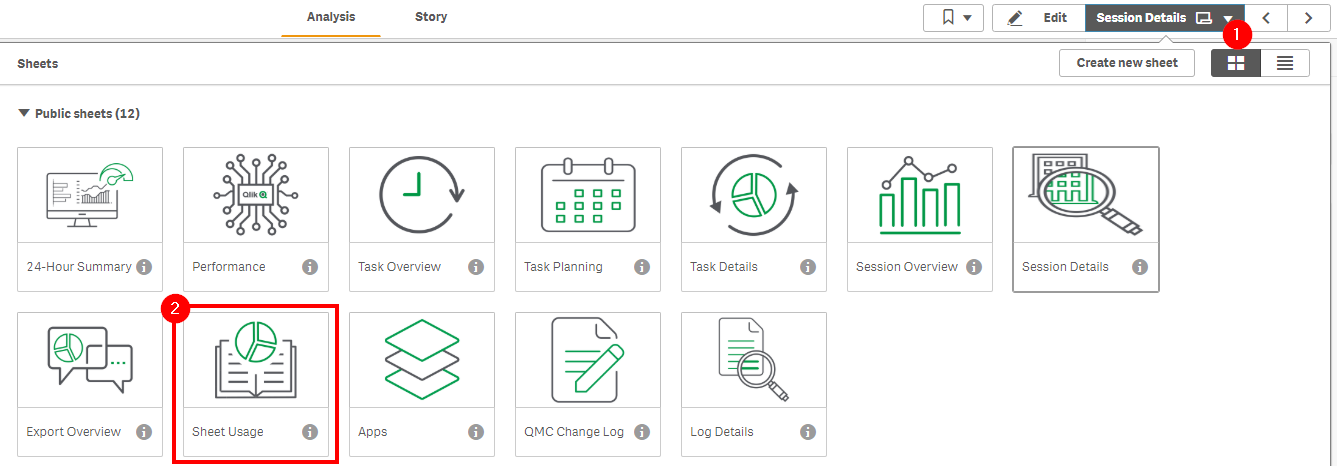
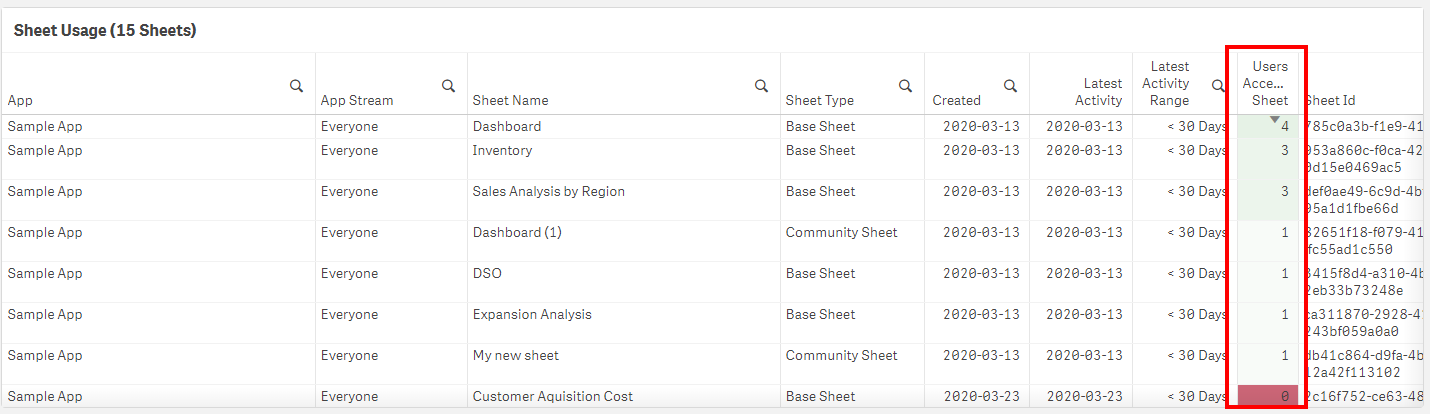
While keeping the five applications selected, navigate to the Sheet Usage sheet.
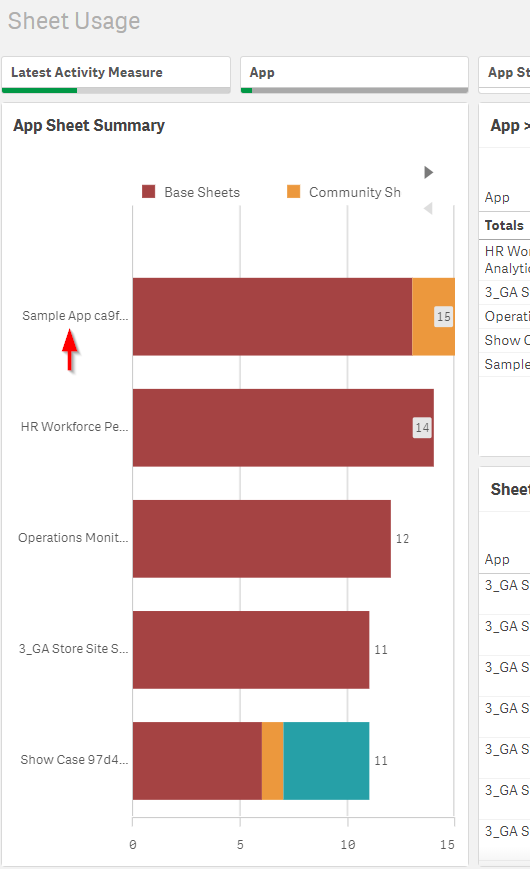
One can now visualize the number of sheets (Base, Community, and Private) that are in each selected application.
To simply the process, it is suggested to select only one application at a time. Feel free to bookmark the five applications if it is more convenient. In this example, Sample App has been selected.
To reorder the table by the sheet usage, sort the Users Accessing Sheets column descending.
At this point, it is also an option to export the Users Accessing Sheets table and share it with the application owner to optimize the order, as the owner of the application likely knows the content the best.
Protip: It is possible to use Qlik NPrinting to distribute the Sheet Usage table to distribute sheet usage data to application owners.
Protip: If there are community sheets with a higher quantity of sessions than base sheets, it is worth investigating the content of those sheets with the application owners and considering either promoting the sheet to base, or incorporating the content into the base app otherwise.
This process should be repeated for each of the selected applications.
Reorder Application Sheets
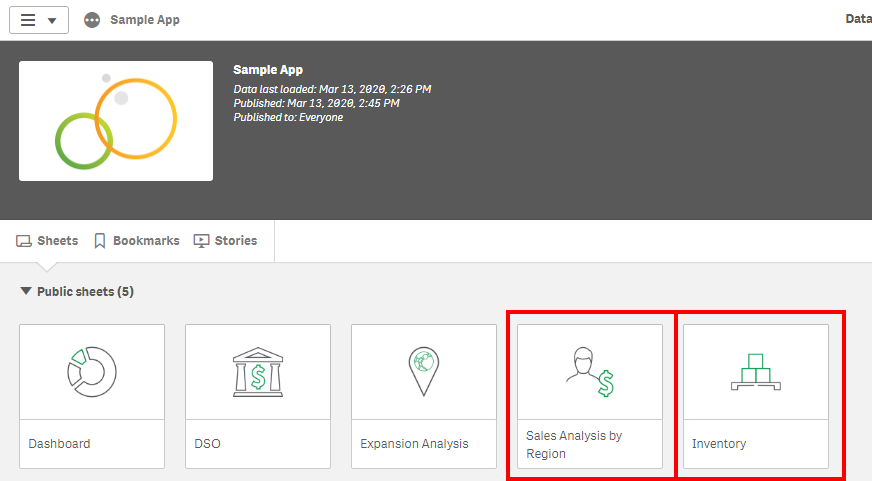
Before reordering the sheets, it is important to analyze the sheet’s logical flow from one to the next combined with the sheet’s usage data.
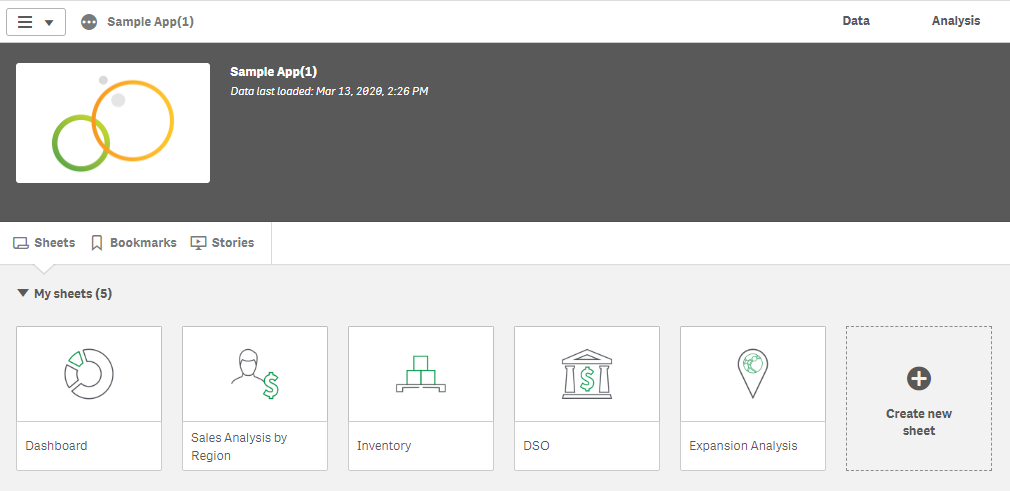
In this example, the Dashboard sheet should remain first, even though it is not the most accessed, so that it doesn’t break the application’s logical flow. The Sales Analysis and Inventory will be moved.
To change the sheets order, the administrator or application owner should clone the application.
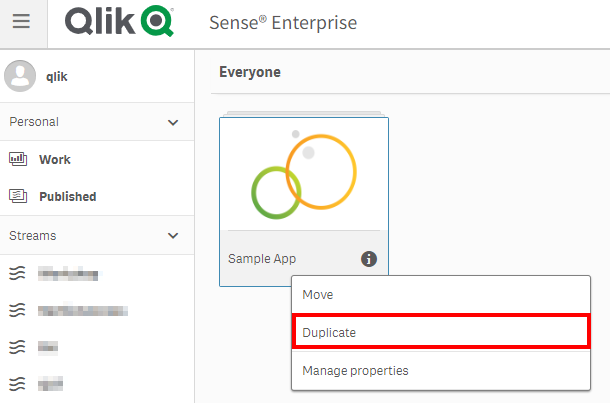
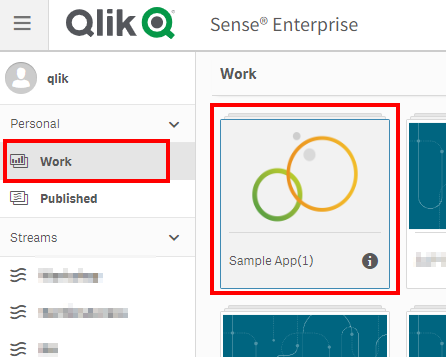
As soon as the application gets duplicated, the new duplicated application will reside in the owner’s My work area.
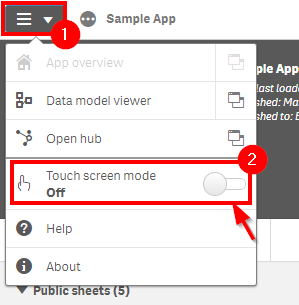
Open the application, and ensure that the Touch screen mode feature is turned off.
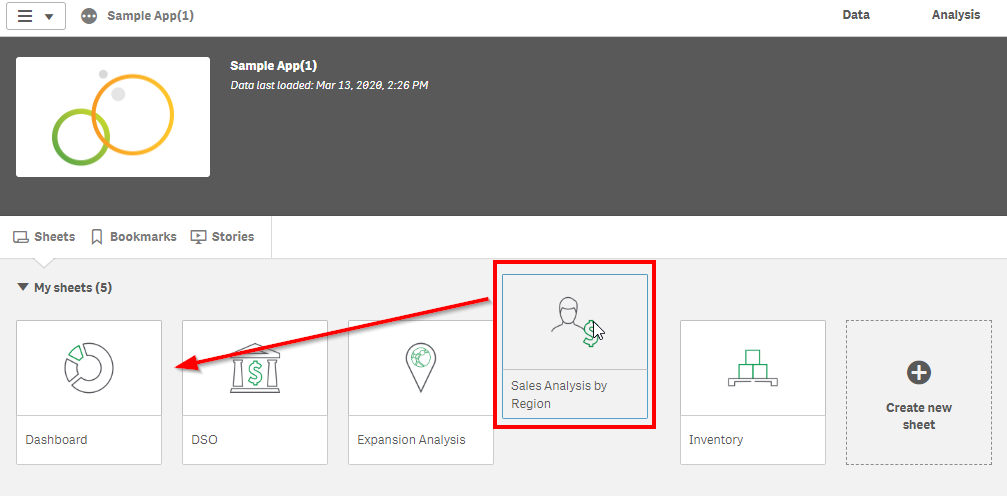
Sheets can be moved by dragging and dropping them to a new position. In this case, the Sales Analysis by Region will be moved to the second position.
The Inventory sheet will be shifted to the third position.
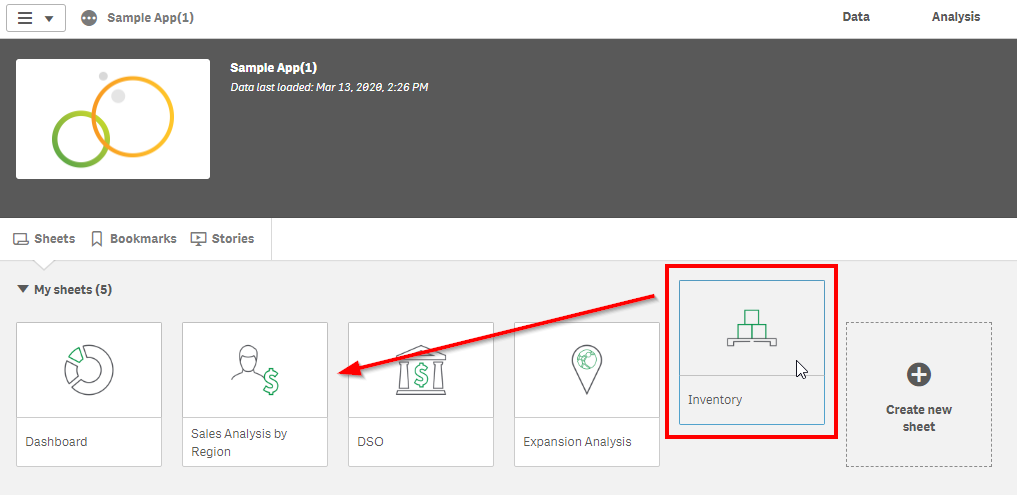
The sheet order has now been optimized.
Following, the application should now Publish and replace the original.
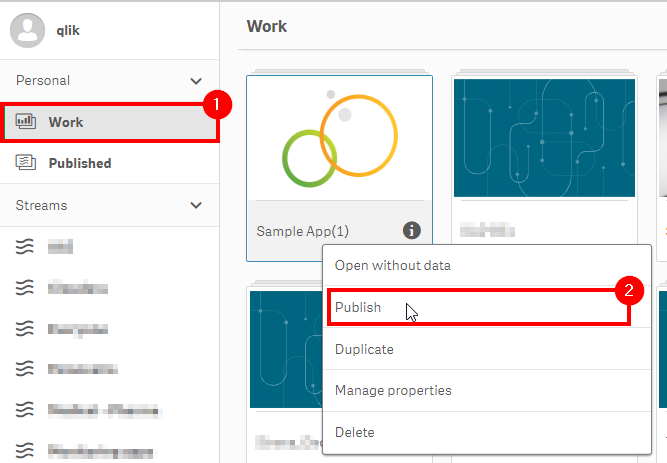
Make sure to check the Replace the existing app box.

Tags
#quarterly
#asset_management
#apps
#sheets
#operations_monitor